Perspectives on 2019 Corn and Soybean Acres: Impact of Prevent Plant
The Farm Service Agency (FSA) of the U.S. Department of Agriculture released county acreages for crops and prevent plantings based on acreage reports filed by farmers. Even though prevent plant totaled 19 million acres in the United States, planted corn acres in 2019 are only slightly lower than 2018 values. With notable exceptions, corn acres decreased in counties that had large areas of prevent planting and increased in acres with little prevent planting. Soybean acres fell over the vast majority of counties in the United States.
FSA Acreage Data
FSA released their first set of 2019 county-level acreage data on August 1 (see Crop Acreage Data of FSA). This data indicated that there were 85.9 million acres of corn planted in the United States, down by 1% from the 2018 plantings of 86.4 million acres (see Table 1)
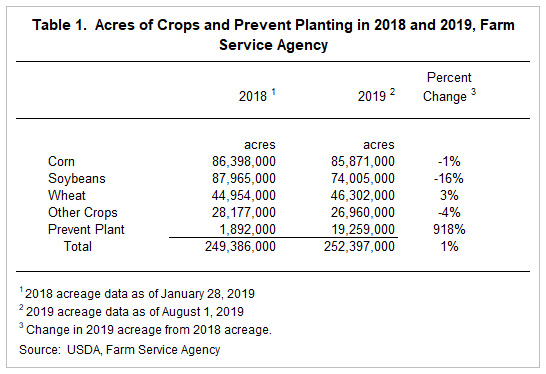
The 2019 planting number (85.9 million acres) is expected to increase as FSA continues to update values monthly until January 2020. From 2011 to 2018, corn acreage in the final January report averaged 1.8% higher than the initial August report. However, in recent years, the increase has been much lower. From 2016 to 2018, the January value was .7% higher than the initial August value. A 1.3% increase – the average from 2011 to 2018 – would increase 2019 planted corn acres to 87.4 million acres. A .7% increase – the average from 2016 to 2018 – would increase planted acres to 86.4 million acres, roughly the same as the planted acreage for 2018.
The August 2019 report indicated that 19.2 million acres were prevented from being planted, a substantial increase over the 2018 value of 1.8 million acres. From 2011 to 2018, the average acres of prevent planting is 4.8 million acres, with the highest acres of 9.6 million occurring in 2011. The 19.2 million acres of prevent plant would be more than double the 9.6 million high occurring in 2011.
The report also indicated that soybean acres declined from 87.7 million acres in 2018 to 74.0 million acres in 2019, a decrease of 16% (see Table 1). Higher prevent plant acres resulted in lower soybean acres. However, higher prevent plant acres did not lower corn acres, but there were large regional shifts in corn acres. With notable exceptions, those shifts were related to the amount of prevent planting.
Prevent Planting and Corn Acre Changes
Figure 1 shows prevent plant acres as a percent of total reported acres. As can be seen in Figure 1, most counties in the country had less than 1% of their acres reported as prevent plant. Prevent plant predominates in the corn belt, with the notable exception of northern and central Iowa. Prevent plant also occurred in the upper Midwest, eastern seaboard, and in the Mississippi delta. The following states have at least one county with over 24% of their acres as prevent plant: Arkansas, Illinois, Indiana, Kansas, Louisiana, Michigan, Minnesota, Mississippi, Missouri, New Jersey, New York, Ohio, South Carolina, South Dakota, Tennessee, Texas, and Wisconsin.
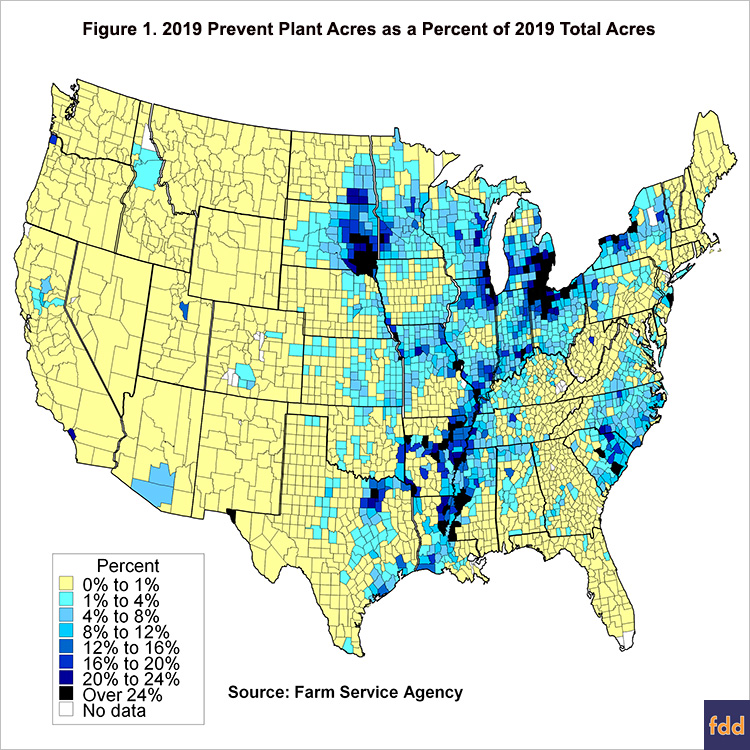
Figure 2 shows the percent change in corn acres between 2018 and 2019 for those counties with at least 20,000 acres planted to corn in 2018. Overall, corn acres in 2019 are down by 1% from 2018 values. There were geographical dimensions to changes. Many counties in North Dakota, Nebraska, Kansas, and the lower Mississippi Delta increased corn acres by more than 15% (see Figure 2). Those 15% increases occurred in counties that typically had very low prevent plant acres.
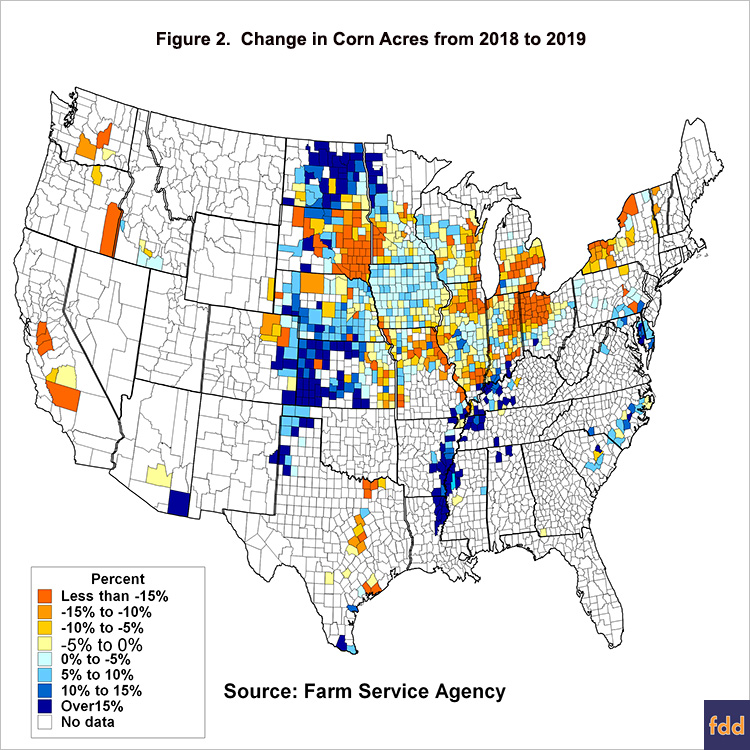
Change in acres in Iowa, Illinois, Indiana, and Ohio are illustrative. Iowa had many counties with low prevent plant acres, and total corn plantings increased 314,000 acres (3% increase). Illinois had many counties with high levels of prevented planting, and corn planting decreased 532,000 acres (5% decrease). Indiana also had significant prevent planting, and corn planting decreased 294,000 acres (5% decrease). Finally, Ohio had substantial prevent planting, with corn planting decreasing 737,000 acres (15% decrease).
Soybean Acre Changes
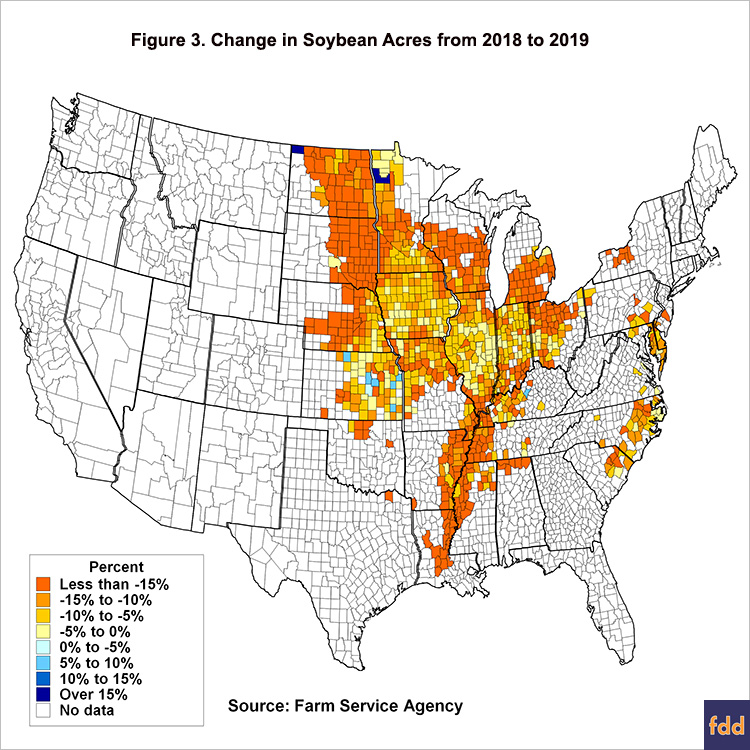
Overall, soybean acres decreased in the vast majority of counties across the United States (see Figure 3). Counties without much prevent plant typically had lower decreases in soybean acres than counties with more prevent plant.
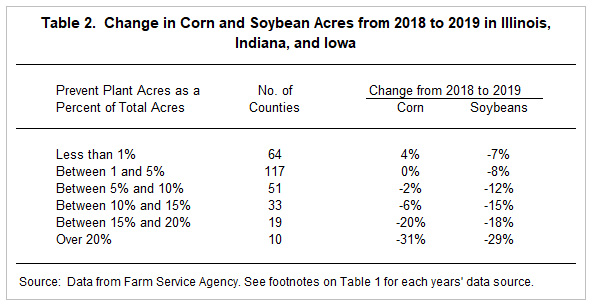
Acreage changes in the three I-states illustrate the corn and soybean planting responses. Counties in Illinois, Indiana, and Iowa were divided into categories based on the percent of acres that were prevent plant. Sixty-four counties had less than 1% of their acres as prevent plant (see Table 2). Those counties increased corn acres by 4% and decreased soybean acres by 7%. Both corn and soybean acreage decreased as the percent of prevent plant acres increased, with corn having more substantial declines than soybeans. Corn acreage increased by 4% for those counties where prevent plant acres were less than 1%, and held even when prevent plant was between 1% and 5%, but decreased 31% when prevent plant acres was above 20% of total acres. Soybean acres decreased by 7% when less than 1% of prevent plant acres, with a much larger decrease of -29% when prevent plant acres were over 20%.
Commentary
Acreage shifts from soybeans to corn were expected at the beginning of the year. For example, USDA’s Prospective Plantings report released at the end of March suggested that corn planted acreage would be up by 4 percent and soybean acreage would be down by 5 percent. The large amount of prevent planting significantly impacted acreage responses this year, but it seems clear that farmers cut soybean acres more than expected. At the same time, corn acres were maintained at 2018 levels. Among the possible explanations for maintaining corn acres while reducing soybean acres are:
- Corn was projected to be more profitable than soybeans for 2019 earlier in the year;
- Soybeans will have a large projected carryout at the end of the marketing year, reducing the chance of price increases;
- The Chinese trade war and African Swine Flu situation further clouded the price outlook for soybeans;
- Crop insurance guarantees were more favorable for corn than soybeans. The corn projected price was $4.00 per bushel, roughly the same level as in the three previous years. The soybean projected price was $9.54, over $.50 lower than projected prices in 2017 and 2018;
- Most farmers purchased Revenue Protection (RP), a product with a guarantee increase. There were chances of a short crop year for corn, resulting in a higher harvest price and potentially larger crop insurance payments for corn; and
- Futures prices for corn where high relative to soybeans through much of May, June, and July.
In sum, many headwinds suggest a less than resilient soybean outlook and a more favorable corn price outlook. This could have encouraged farmers to plant corn even into June. In addition, USDA announced Market Facilitation Program (MFP) payments for 2019 that required farmers to plant acres to receive a payment, which could have prompted both corn and soybean plantings.
Finally, current values from FSA acreage data suggest slight decreases in corn acres. National Agricultural Statistical Service (NASS) values suggest increases from 2018 to 2010: 89.1 million U.S. corn acres in 2018 to 90.0 million in 2019. The increase in NASS planted acres differs from the slight decrease currently in FSA values. If FSA values do not increase like has occurred in recent years, NASS planted acres may come down.
Disclaimer: We request all readers, electronic media and others follow our citation guidelines when re-posting articles from farmdoc daily. Guidelines are available here. The farmdoc daily website falls under University of Illinois copyright and intellectual property rights. For a detailed statement, please see the University of Illinois Copyright Information and Policies here.


