


Strip-Till Implementation in Illinois
Strip-till is a relatively common tillage practice on farmland that will be planted to corn in east-central Illinois, accounting for about 14% of the acres planted to corn in Precision Conservation Management (PCM) from 2015 to 2018. Returns to strip-till have been roughly the same as other one-pass tillage systems, with one-pass systems having higher returns than either two-pass or no-till systems. Nutrients applied using strip-till vary across farms. The highest returns are associated with farms that do not apply anhydrous ammonia with the strip-till pass.
Precision Conservation Management (PCM)
We summarize data from corn production on farmland in east-central Illinois for the years from 2015 to 2018. PCM is a farmer service program led by the Illinois Corn Growers Association in partnership with over 30 entities including other commodity associations, conservation groups, private foundations, supply chain providers, the Soil and Water Conservation Districts, and the Natural Resource Conservation Service (NRCS). In an effort to address the goals of the Illinois Nutrient Loss Reduction Strategy, the mission of PCM is to help farmers make decisions about adopting on-farm conservation practices in a financially responsible way. Through PCM’s regional Specialists, PCM works one-on-one with over 200 farmers enrolled in its 16-county service area, representing over 200,000 acres of Illinois farmland.
For this article, PCM provided aggregated farmer data to further explore how the economics of tillage practices on farms. For each field in PCM, the farmer indicated all of their field passes, as well as input usage. Yields and moisture levels also were included. This data were used to develop an economic report from each field. This report included:
- Revenue from crop sales. The field’s yield was multiplied by a standard yearly price the same across all farms.
- Direct costs. Direct costs included seed, fertilizer, pesticides, drying, storage, and crop insurance. Inputs applied to the field were multiplied by a standard input price the same across all farmers.
- Power costs. Each field pass was assigned a cost based on Machinery Cost Estimates from the University of Illinois. The sum of all these field pass costs represented machinery-related power costs.
- Overhead costs. Overhead costs were based on FBFM data and the same for all farms.
These economic reports resulted in operator and land returns, a measure of return for farmland. Operator and land return does not include a cost for land. Subtracting off a land cost, such as cash rent, would give a farmer return.
Operator and land returns are summarized across tillage benchmarks and strip-till types in the following sections.
Tillage Benchmarks
Operator and land returns for farmland that were planted to corn are summarized based on the number of tillable passes performed before planting corn. The following tillage benchmarks resulted:
- No-till – no-tillage before planting corn.
- Strip-till – perform one strip-tillage pass before corn. Some fields had two strip-till passes. These two-strip-till systems are not summarized below.
- One-pass-light – one tillage system without a deep tillage pass included.
- Two-pass-light – two tillage pass systems with those tillage passes not including a deep tillage pass.
- Two-pass-medium – included one deeper tillage pass.
- Two-plus – had three or more tillage passes.
Note that only tillage passes went into the definition of the system. All systems had other passes that included fertilizer applications, spraying pesticides, planting, and harvesting.
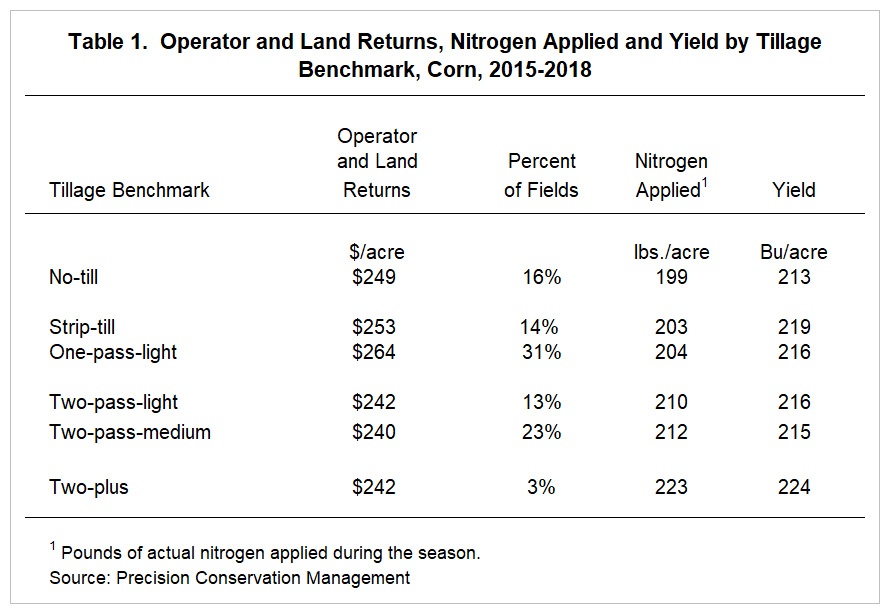
Table 1 shows the percent of farms falling into each benchmark, as well as the average return, amount of nitrogen applied, and yield. Note that strip-till had a $253 per acre return and one-pass light systems had a $264 per acre return. These one-pass systems had higher returns than any of the tillage systems with more tillage passes: two-pass-light had $242 return, two-pass-medium had $240 return, and 2-plus system had $242 return. Two-pass systems did not have higher yields than one-pass systems such that there was not an offset associated with the higher tillage costs associated with two-pass systems. While two-plus systems had higher average yields, the additional yield from two-plus systems did not cover the higher costs of the systems.
Strip-Till Applications
Of the fields in the strip-till benchmark, 81% of strip-till passes occurred in the fall and 19% occurred in the spring. Table 2 shows the percentage of fields by nutrient applied during strip-till and the average operator and land return for each type of nutrient application. Liquid fertilizer application include UAN, custom liquid fertilizer, or UAN 32% and custom liquid fertilizer.

The majority of strip-till passes included a nutrient application. Anhydrous ammonia is the product most often applied with strip-till, followed by strip-till only. On average, liquid fertilizer strip-till application has the highest return at $315 per acre, followed by strip-till only. Anhydrous ammonia strip-till application has the lowest returns, with an average of $218 per acre.
Strip-Till and Nitrogen
More detail on the timing of nitrogen application is provided in Table 3. Timing of nitrogen applications are characterized as:
- Mostly fall – the majority of nitrogen is applied in the fall.
- Mostly pre-plant – the majority of nitrogen is applied in spring prior to planting.
- 3-way split – nitrogen is roughly evenly split across three nitrogen applications.
- 50% pre-plant/50% sidedress – roughly half the nitrogen is applied prior to planting and 50% is applied after planting.
- Mostly sidedress – most of the nitrogen is applied after planting.
When anhydrous ammonia was applied, 84% of the fields had most nitrogen applied in the fall (“Mostly Fall” in Table 3), with 16% split between pre-plant and sidedress (“50% pre-plant/50% sidedress” see Table 3).

Table 4 shows the average operator and land return from 2015-2018 on strip-till field by nitrogen class. Mostly because of higher yields, trip-till fields categorized as 3-way split have the highest average returns at $292 per acre of any nitrogen benchmark.

Summary
Farmers in Illinois use strip-till in a variety of ways. Even though the most often-applied product with strip-till is anhydrous ammonia, the majority of strip-till fields in this sample applied most of the N fertilizer application in sidedress operations. Strip-till is an economically competitive tillage method. There are other factors which may contribute to a farmer’s decision on whether or not to implement strip-till, such as timing, machinery availability, and labor availability.
Acknowledgements
The authors would like to acknowledge that data used in this study was generated from the Precision Conservation Management (PCM) program, a farmer service program led by the Illinois Corn Growers Association. PCM is currently enrolling farmers in Champaign, Christian, DeWitt, Douglas, Edgar, Ford, Livingston, Macon, Macoupin, McLean, Piatt, Sangamon, Tazewell, Vermilion, and Woodford counties. For more information, please contact PCM by email at info@precisonconservation.org, or visit the PCM website at www.precisionconservation.org.
Reference
Schnitkey, G. and L. Gentry. “Tillage Passes and Returns on Corn-Soybean Farms in East-Central Illinois.” farmdoc daily (9):53, Department of Agricultural and Consumer Economics, University of Illinois at Urbana-Champaign, March 26, 2019.
Disclaimer: We request all readers, electronic media and others follow our citation guidelines when re-posting articles from farmdoc daily. Guidelines are available here. The farmdoc daily website falls under University of Illinois copyright and intellectual property rights. For a detailed statement, please see the University of Illinois Copyright Information and Policies here.