2019 Illinois County and State Cash Rents
Cash rents in Illinois remained roughly the same in 2019 as in 2018, continuing a string of years with little changes in cash rents. In this article, average cash rents for 2019 are shown for the state of Illinois and counties in Illinois. There will be downward pressures on 2020 cash rents.
State Cash Rents
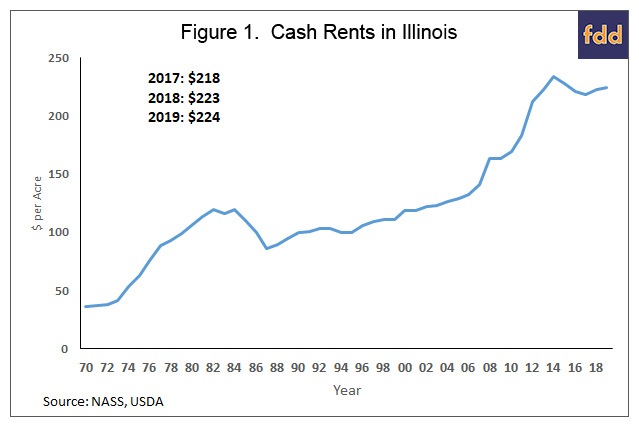
The National Agricultural Statistical Service (NASS), an agency of the U.S. Department of Agriculture, reports an average cash rent for the state of Illinois each year. For 2019, NASS estimates the average cash rent in Illinois at $224 per acre, up $1 per acre from a $223 per acre level in 2018 (see Figure 1).

Cash rents increased dramaticlly from 2006 to 2013, the period in which corn and soybean prices increased and remained at high levels. Average cash rents were $132 per acre in 2006 and increased by $102 per acre to $234 per acre in 2014. Corn and soybean prices declined in 2014, and cash rents declined by modest amounts in each year from 2015 to 2017: $228 per acre in 2015, $221 per acre in 2016, $218 per acre in 2017. Then, cash rents increased to $223 in 2018. The 2019 level is only $1 per acre higher than the 2018 level. Overall, cash rents have been relatively stable in recent years.
County Cash Rents
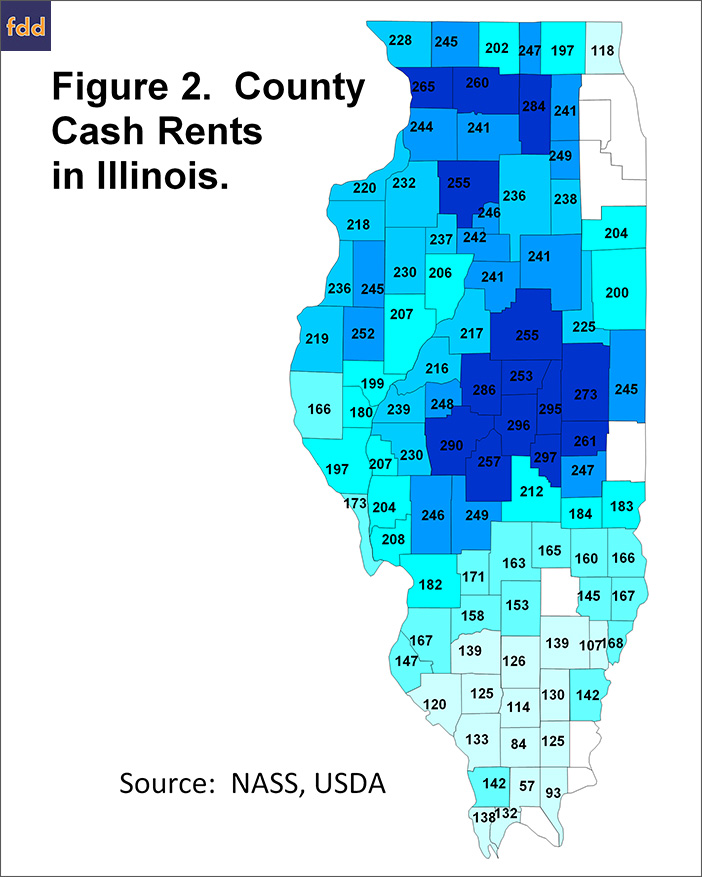
There is a great deal of variability in rents across Illinois. For 2019, average cash rents ranged from a high of $297 per acre for Moultrie County and a low of $57 per acre in Johnson County (see Figure 2). Overall, the highest cash rents are in the central and northern parts of the state, and the lowest cash rents are in the southern part of the state. Average cash rents follow trends in soil productivity, with higher cash rents in counties with the highest soil productivity.

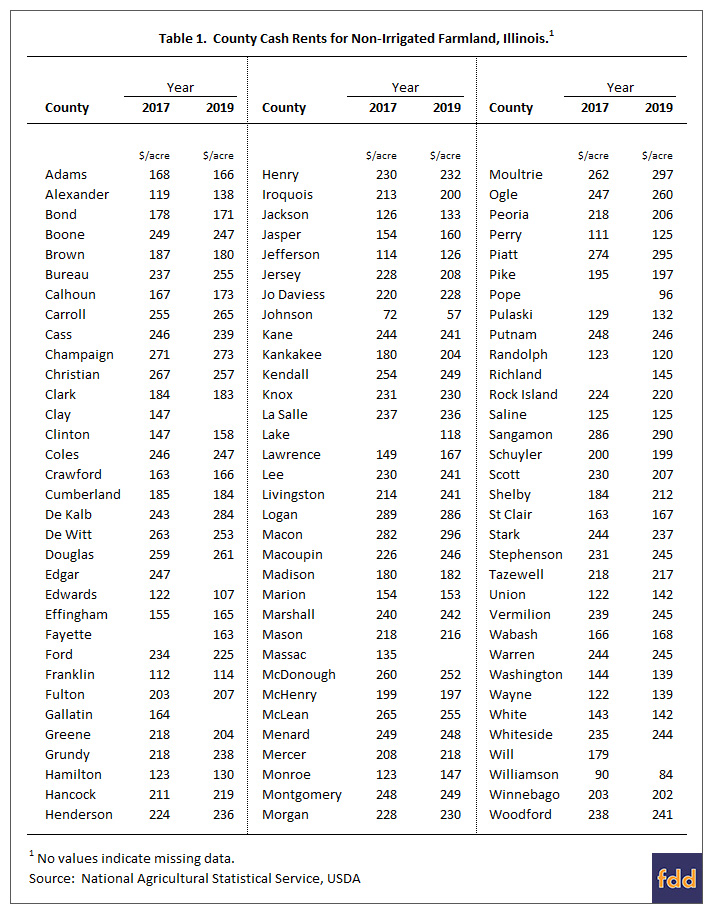
NASS is on an every other year schedule for releasing county cash rents. Table 1 shows a comparison of 2017 to 2019 county cash rents. Note that there are some counties that do not have a cash rent reported for 2019. In these cases, the 2017 rent plus a $4 increase will be a good estimate of the 2019 cash rent for that county.

Overall, average cash rents across counties increased $4 per acre from 2017 to 2019, roughly matching the $6 increase in the state cash rent between 2017 and 2019. There were some counties with large changes between 2017 and 2019. It is difficult to explain those changes based on geographically region of the state. Large differences likely are due to sampling. Overall, there is a great deal of variability of cash rents within a county. It is common to see over $50 per acre variances in parcels next to one another. As a result, the above averages do not necessarily match the cash rent for an individual parcel. Moreover, changes in sample from which cash rents are drawn can have large impacts on averages.
Outlook for 2020 Cash Rents
Downward pressure is expected on 2020 cash rents because of very low incomes in 2019 (see farmdocDaily July 16, 2019). Prospects are for continue low incomes into 2020. How much cash rents change this year remains to be seen.
Disclaimer: We request all readers, electronic media and others follow our citation guidelines when re-posting articles from farmdoc daily. Guidelines are available here. The farmdoc daily website falls under University of Illinois copyright and intellectual property rights. For a detailed statement, please see the University of Illinois Copyright Information and Policies here.


