


Market Reaction to USDA’s August Corn Crop Reports
Excessive rains this spring delayed planting across the Corn Belt. In Illinois, for instance, the corn crop only reached 50% planting during the first week of June; over the previous five years, that mark was reached over a month earlier (see farmdoc daily, July, 26, 2019). One of several important factors, increased late plantings can indicate lower corn yields, although this is not always the case—in 2009, the national corn yields was ten bushels above trend despite planting delays (see farmdoc daily, May 7, 2019), while below-trend yields followed the historically-early plantings of 2012 (see farmdoc daily, April 18, 2012, and Pitt, 2013). Market observers wondered whether the wet weather would reduce corn acreage forecasts, too, by preventing planting entirely.
Taken together, many believed that poor weather this year would reduce 2019 corn production, and their expectations reflected that (see farmdoc daily, August, 12, 2019). Ahead of USDA’s August 12 reports, the trade expected planting delays to weigh on planted and harvested acreage, and yield—supporting higher prices. Given the unusually large number of unplanted acres encountered in its standard June survey, NASS re-surveyed 14 major corn-producing states in July (Braun, 2019). USDA re-surveys as a standard procedure if planting delays occur throughout a particular region. In 2013, NASS re-surveyed soybean planted acreage in 14 states due to delays in planting (NASS, 2013); in 2015, NASS re-surveyed planted acreage for cotton in Texas, sorghum in Kansas, and soybeans in three states (NASS, 2015). USDA used both satellite imagery and re-survey results, as well as certified planted acre data from the Farm Service Agency (FSA), to generate its August reports.
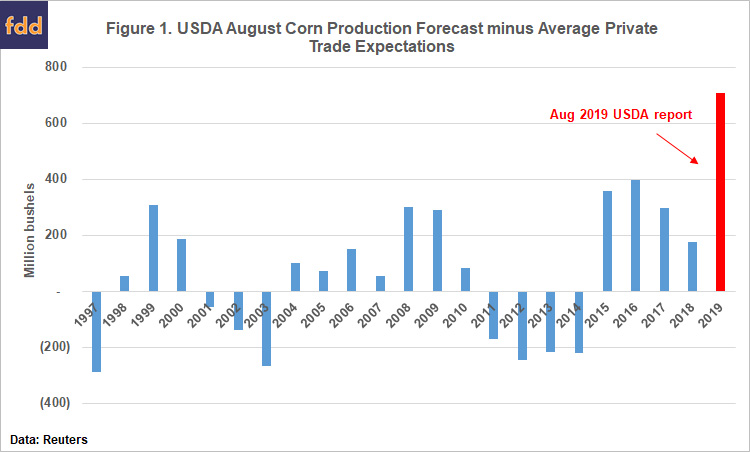
Clearly, market participants surveyed by Reuters expected USDA to lower its production projections in its highly anticipated World Agricultural Outlook Board (World Board) and National Agricultural Statistics Service (NASS) August 12 reports. The opposite occurred: USDA actually increased its own corn forecast by 26 million bushels (+0.2%). While both USDA’s planted and harvested acreage projections fell compared to July, they did not fall as far as the trade expected. USDA’s forecast for many elements of the balance sheet were higher than average trade expectations[1]: 2.2% higher for planted acreage, 2.3% for harvested acreage, and 2.7% for yield. In the first survey-based forecast of the season USDA increased its projected yield to 169.5 bushels/acre, 3.5 bushels/acre more than its July estimates. Overall, USDA’s 2019 corn production forecast exceeded the average trade expectation by over 5%, the largest corn production ‘market surprise’ in at least two decades (see Figure 1).
How did the markets react to the August 12, 2019 USDA Report?
USDA’s August forecasts were received with scrutiny, by some (Hirtzer, 2019). Initial reactions to the USDA projections of planted acreage, particularly in light of the news about likely record prevented planting claims “approached complete disbelief” (see farmdoc daily, August, 19, 2019). USDA’s estimates surprised some traders and growers who expected rain-delayed planting to weigh more heavily on its corn outlook, after re-surveying producers and studying satellite imagery in July (Parker, Hirtzer, and Almeida, August 22, 2019). Equally scrutinized was the estimated national yield, which was deemed by many to be too high given the late planting of the corn crop this spring (see farmdoc daily, August, 19, 2019).
Yesterday, a subset of this article’s authors detailed the different sources of data USDA uses to produce its corn acreage and yield estimates, (see farmdoc daily, October, 3, 2019). Even though August Crop Production estimates defied trade expectations, ensuing updates to corn acreage and yield data back them up. In this article we consider how markets that reflect actual trading positions of buyers and sellers responded to USDA’s surprising August news.
- Reaction of December-delivery futures is consistent with previous USDA report ‘surprises’
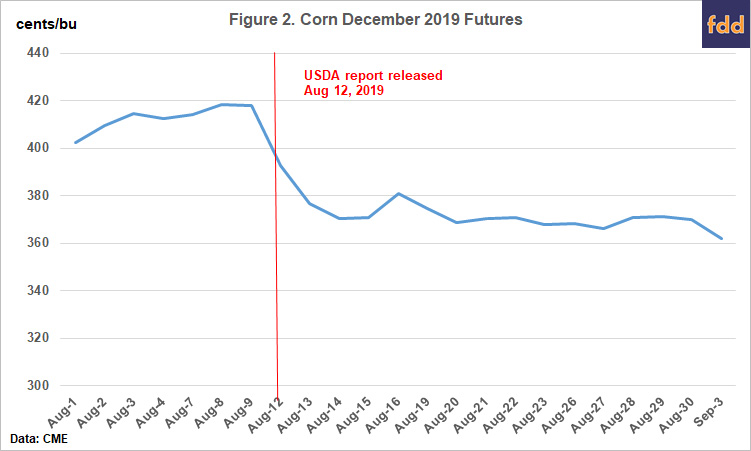
The (very bearish news in the) August reports led new crop corn futures prices down immediately. Chicago Mercantile Exchange (CME) December delivery corn prices fell by 25 cents/bushel, or 6%, and the market locked limit down (meaning that no trades with a lower price could be recorded on the exchange, that day). By market close on the following day, the corn price fell an additional 16.25 cents/bushel—a two-day loss totaling 41.25 cents, or 9.9% of the value of the corn contract on 8/9/2019, the day prior to the USDA announcement (see Figure 2). The cumulative decline in December contract corn prices during the month of August exceeded 40 cents a bushel, one of the largest on record for that month.
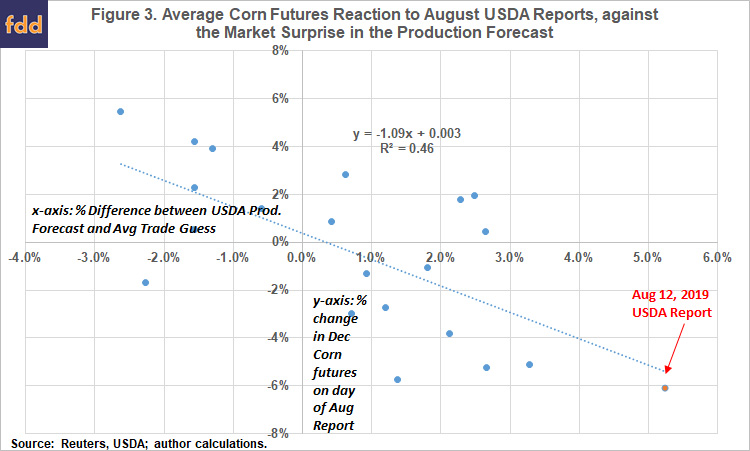
However, Figure 3 shows that the market reaction—in terms of price—to the August report was within historical bounds; the figure plots the relationship between USDA report ‘surprises’ and December-expiry corn futures prices on the day of report publication, where market surprise is defined as the difference between USDA’s August corn production forecast and the average private trade guess. As expected, corn prices tend to rise on smaller-than-expected production surprises, and tend to fall when USDA production forecasts exceed the average trade guess. On average, a 1% larger-than-expected USDA production surprise is followed by a reduction in futures price of about 1.1%. This past August’s report produced a price reduction of just below the line of best fit, meaning that the market reaction was slightly larger than might be expected; but, it is certainly not an outlier conditional on the size of the surprise, at least visually. Because the corn market locked limit down that day, and the next day was followed by a lower price, the market reaction in the chart may be understated. However, when the analysis in Figure 3 is performed using the day-after-USDA-report opening prices, we find very similar results. Overall, the observed reaction to USDA’s August reports is consistent with the way the market has responded, historically.
- Implied and realized corn market volatility patterns are not out of the ordinary
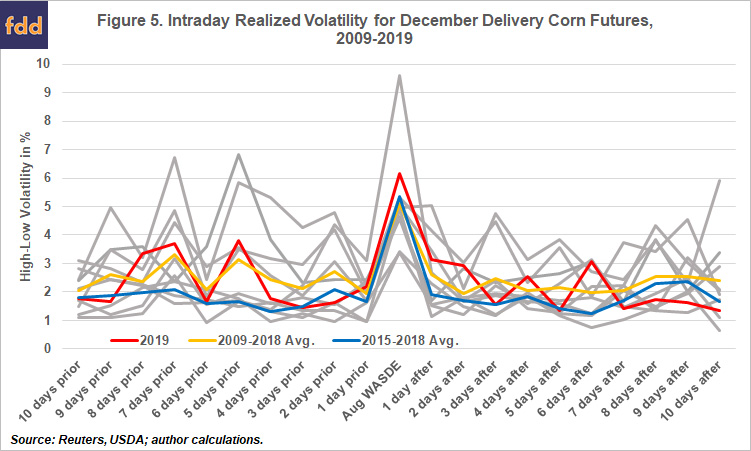
Figures 4-6 display corn prices and volatilities for the corn harvest (December delivery) contract in a window around the August report date. The red series in those figures depicts the path the market followed in 2019; the blue line is the average value observed from 2015-2018; the yellow line is the average observed from 2009-2018; gray series represent the values observed in other, individual years from 2009-2019. Differences between the red line and the other series could indicate outliers, compared to the previous ten years, that may be worthy of more investigation. The dispersion of the gray values captures the range of observations.
Figure 4 shows that in 2019, the expected futures price volatility implied (IV) by at-the-money options premia declined notably on the release of the August reports. This decline in IV is consistent with how the market normally behaves at the release of USDA news (Adjemian et al., 2018). USDA reports usually contain valuable information that reduces market uncertainty, and therefore expected price volatility: that regularity is depicted by the yellow series, which dips on the August release day.
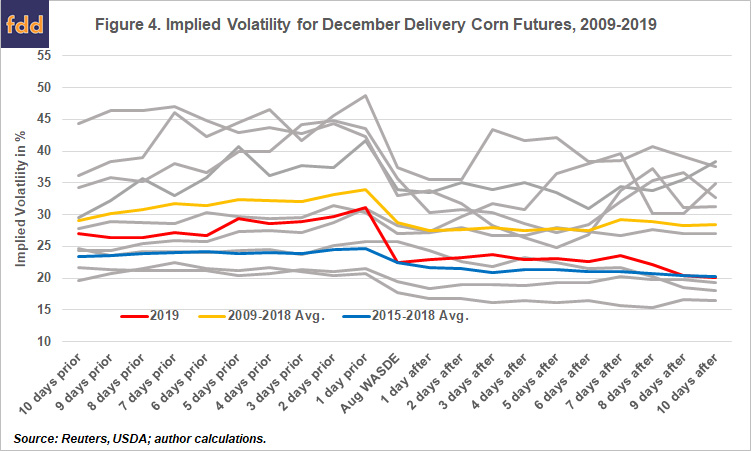
Figure 4 shows that during August, the IV level was slightly higher than it has been over the last several years—especially in the pre-reports period—although they were lower than the 10-year historical average. Increased IV levels in 2019 may be due to several factors, including concerns about the impact of weather developments and ongoing trade disputes. Nevertheless, the 2019 IV series actually dips more—meaning relatively more market uncertainty was resolved at announcement than was observed following other, recent August reports, on average (the blue series). Notably, corn market uncertainty, as represented by IV, did not rise measurably over the two trading weeks following the USDA report.
As opposed to IV, which represents expected price volatility over the remaining life of the corn harvest futures contract, Figure 5 depicts observed intraday trading volatility. We measure that volatility as the percentage difference between the highest and lowest prices that corn traded on a given trading day. As shown in the chart, the USDA August reports’ release day is normally associated with a volatility spike. Other trading days in the window also display spikes over the years, but the report day is consistent—every year sees a notable volatility bump compared to the trading days just before or after. After the report comes out, intraday volatility tends to decrease slightly, or become less noisy. The results in Figure 5 indicate that intraday volatility in the 2019 corn market around the August reports is not any more out of the ordinary than IV, compared to historical behavior; both are well within usual observed ranges. In addition, observed intraday price ranges in 2019 series trend lower after the August report was published.
- Futures moved in the direction consistent with the USDA surprises, well after release of reports
Figure 6 displays cumulative price moves following USDA’s August reports. All announcement-day price changes are normalized to be negative—just like the price change on August 12th, 2019—for graphical comparison (if the announcement day price change was originally positive, we reverse signs of price changes over the following ten trading days so that the cumulative value is calculated correctly). Persistent, negative values in Figure 6 indicate that corn prices remained lower (higher) than they were the day before the report was published, if announcement day prices fell (increased) at report release. Series that become more negative over the following trading days indicate that market prices continued to move in the direction they moved after USDA published its news. On the other hand, series that become positive indicate that market prices reversed. The blue and yellow series in Figure 6 indicate that, on average, corn market prices respond to USDA news and those prices tend to remain at about the level of the initial response over the next two trading weeks. Of all the figures we present, the 2019 series stands out the most in Figure 6. But the reason it stands out is that corn prices continued to move in the direction that USDA projections indicated—lower, given the surprisingly large crop USDA projects, over the following two trading weeks. Figure 6 shows that the cumulative change in corn prices following the August 2019 report is noticeably larger than it usually is, but in the direction consistent with USDA forecasts. That is notable, given how controversially the reports were viewed by some.
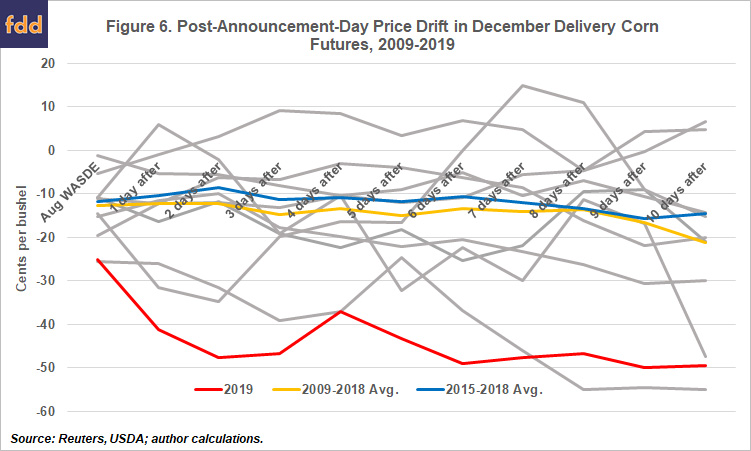
Notes: All announcement-day shocks are normalized to negative values; following-day shocks are reversed if the original announcement-day shock is positive. Values in the chart represent the cumulative change in corn contract price from the day prior to USDA announcement; negative. Negative values are in the direction the market moved on the announcement day.
- Average cash prices also fell, so basis patterns match historical market behavior
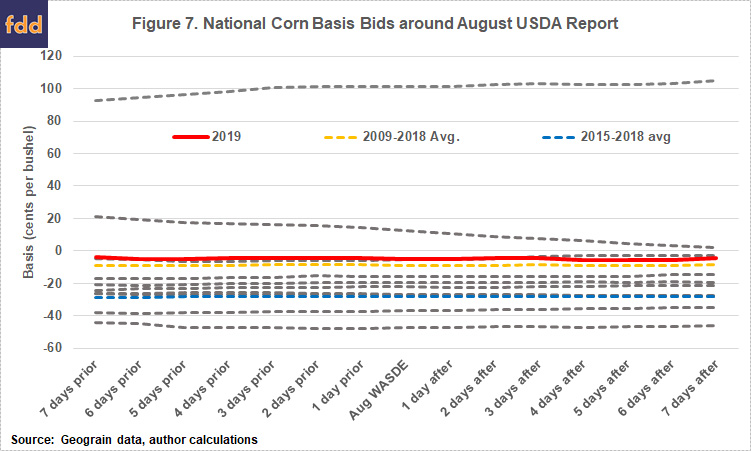
Finally, we examine how local cash markets behaved following the USDA August forecast. If local cash markets responded differently than futures, basis fluctuations should appear surrounding the release of the report. Figure 7 displays the national corn basis in days prior to and after the August USDA reports.[2] The 2019 basis in the figure is virtually flat in the observation window. Like harvest futures, these data indicate that national average corn cash prices also fell on USDA’s news of an unexpectedly-larger crop. This pattern is consistent with the behavior of local cash prices around other, recent USDA August reports.
Summary
Normally, USDA August reports resolve corn market uncertainty, revise expectations about supply and demand fundamentals and foster a new price equilibrium. We show that, despite the concern expressed about USDA corn acreage and yield forecasts this past August, the available futures, options, and cash market price data do not indicate a market reaction that was any more uncertain or volatile than normal. In addition, in the two weeks following the August report publication date, prices for the harvest contract continued to move in a direction consistent with USDA news.
In its September 12 reports—the first to contain data from objective yield surveys this year—USDA’s yield forecast dipped slightly (by 1.3 bushels per acre, or less than 1% of the August yield estimate) while its acreage forecasts remained unchanged. Overall, USDA’s production projection was off just 102 million bushels compared to its August forecast. Corn futures prices have trended higher in recent weeks given positive signs in trade discussions (see Deng, Sept 13, 2019) and a bullish September grain stocks report (see Dehlinger, Sept 30, 2019), among other things. Still, at the time of this writing corn still trades well below the $4.18 recorded at the bell on August 9 (one day before the publication of USDA’s August reports). It is possible that USDA’s outlook about the corn harvest will change as it learns information through its continued monitoring activities. For now, however, the market reaction to USDA’s surprising August news about a larger-than-expected corn crop given the poor spring planting weather looks pretty normal.
Notes
[1] Based on private trade forecasts polled by Reuters.
[2] Values in the chart represent the simple average daily corn bid based on over 3500 observations as reported by Geograin.com. Further, disaggregated analysis at state and county levels shows similarly flat basis changes surrounding the Aug 2019 USDA report.
References
Adjemian, M.K., R. Johansson, A. McKenzie, and M. Thomsen. 2018. “Was the Missing 2013 WASDE Missed?” Applied Economic Perspectives and Policy, 40(4): 653-671.
Braun, K. 2019. “Resetting U.S. corn expectations after USDA's acreage shocker.” Reuters. August 14th.
Deng, C., L. Craymer, and J. Zumbrun. "China to Exempt U.S. Soybeans, Pork From Punitive Tariffs”,
The Wall Street Journal, September 13, 2019. Accessed at: https://www.wsj.com/articles/china-to-exclude-u-s-soybeans-and-pork-from-additional-tariffs-11568370755?mg=prod/com-wsj
Dehlinger, K., M., “Stocks Surprise and Residual Reflections”, DTN, September 30, 2019. Accessed at: https://www.dtnpf.com/agriculture/web/ag/blogs/minding-ags-business/blog-post/2019/09/30/stocks-surprise-residual-reflections
Hirtzer, M. 2019. “Farmers Who Don’t Trust U.S. Data Vow to Hoard Until Prices Rise”. Bloomberg, September 11. Accessed at: https://www.bloomberg.com/amp/news/articles/2019-09-11/farmers-who-don-t-trust-u-s-data-vow-to-hoard-until-prices-rise
Hubbs, T. "August USDA Reports." farmdoc daily (9):148, Department of Agricultural and Consumer Economics, University of Illinois at Urbana-Champaign, August 12, 2019.
Hubbs, T. "Questions about Corn Crop Continue." farmdoc daily (9):153, Department of Agricultural and Consumer Economics, University of Illinois at Urbana-Champaign, August 19, 2019.
Hungerford, A., S. Arita and R. Johansson. "Examining USDA 2019 Acreage and Yield Estimates." farmdoc daily (9):185, Department of Agricultural and Consumer Economics, University of Illinois at Urbana-Champaign, October 3, 2019
Irwin, S. and D. Good. "2012 Corn Crop To Be The Earliest Ever Planted?." farmdoc daily (2):72, Department of Agricultural and Consumer Economics, University of Illinois at Urbana-Champaign, April 18, 2012.
Nafziger, E. "Corn and Soybean Crops at Mid-Season, 2019." farmdoc daily (9):137, Department of Agricultural and Consumer Economics, University of Illinois at Urbana-Champaign, July 26, 2019.
Parker, M., M. Hirtzer, and I. Almeida. 2019. “Farm Tensions Escalate as USDA Staffer Threatened in Midwest.” Bloomberg. August 21st. Accessed at: https://www.bloomberg.com/news/articles/2019-08-21/usda-pulls-staff-out-of-crop-tour-after-threat-to-employee
Pitt, D. 2013. “Final 2012 drought report shows corn harvest took hardest hit.” Washington Post. January, 14th. Accessed at: https://www.washingtonpost.com/politics/final-2012-drought-report-shows-corn-harvest-took-hardest-hit/2013/01/13/a66113d2-5c45-11e2-88d0-c4cf65c3ad15_story.html
Schnitkey, G. and C. Zulauf. "Late Planting Decisions in 2019." farmdoc daily (9):83, Department of Agricultural and Consumer Economics, University of Illinois at Urbana-Champaign, May 7, 2019.
United States Department of Agriculture, National Agricultural Statistics Service. 2013. “NASS to Collect Additional Soybean Acreage Data”. Accessed at: https://www.nass.usda.gov/Newsroom/Notices/2013/06_28_2013.php
United States Department of Agriculture, National Agricultural Statistics Service. 2015. “NASS to Resurvey Growers for Acres Planted in Several States”. Accessed at: https://www.nass.usda.gov/Newsroom/Notices/2015/06_30_2015.php
United States Department of Agriculture, Office of the Chief Economist. 2019. “Update of 2019 FSA Acreage Data and FAQs on USDA Acreage”. Accessed at: https://www.usda.gov/oce/commodity/reports/NASSandFSAacreage_08222019.pdf
Disclaimer: We request all readers, electronic media and others follow our citation guidelines when re-posting articles from farmdoc daily. Guidelines are available here. The farmdoc daily website falls under University of Illinois copyright and intellectual property rights. For a detailed statement, please see the University of Illinois Copyright Information and Policies here.