


Acres & Crisis: Prospective Plantings and Perspectives from the Past
The novel coronavirus pandemic and the massive reaction in America and around the world to try and halt the spread has created a situation without a straight-forward historical analogue. For farm policy this is also true. In the scramble to work out appropriate policy responses there may be value in historical perspectives on acreage responses during previous times of crisis.
Background
USDA released its Prospective Plantings report on March 31 and it was most notable for indicating that farmers intended to play nearly 97 million acres of corn in 2020 (farmdoc daily, April 6, 2020). The report is, of course, early and merely a measure of intentions rather than actual planted acres. It also involves responses prior to the novel coronavirus pandemic and the global response (farmdoc webinar, April 3, 2020). It cannot be outright dismissed, however, because planting season is already underway and even those farmers who have yet to begin to plant have already made seed and other input purchases.
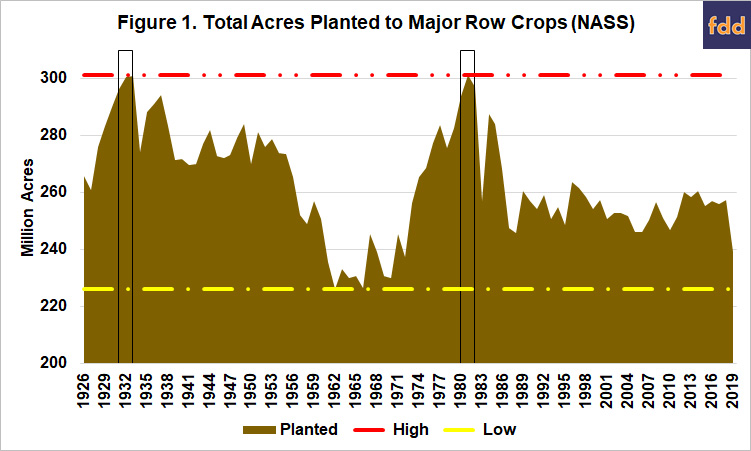
Seventy-five million acres separate the highest and lowest level of acres planted to the major row crops (corn, wheat, soybeans, cotton, barley, oats, rye, sorghum, rice and peanuts) according to USDA’s National Agricultural Statistics Service. The highest level of planted acres to these commodities is 301 million acres and has occurred three times since 1926: 1932, 1933 and 1981. The lowest level was 226 million acres in 1962 and 1966. In the Renewable Fuels Era (2005 to 2019), the average of total acres planted to these commodities is 253 million acres. Only 239 million acres were planted in 2019.
In addition, USDA’s Economic Research Service reports that total cropland used for crops acres peaked at 387 million acres and has not fallen below 327 million acres. In a similar pattern to planted acres in Figure 1, the total cropland peak of 387 million acres has occurred twice in history, in 1949 and 1981 but approached that peak from 1929 (379 million acres) through 1932 (384 million acres). The lowest level of total cropland used for crops (327 million acres) has been reached only once in 1988, although 2011 was close with 328 million acres.
Discussion
Highlighted in Figure 1 are the peak years for acreage, 1932, 1933 and 1981. Total planted acres for the major row crops increased in the early years of the Depression, adding 18 million acres to the 283 million acres planted in 1929. The historic high acreage level of 301 million acres planted was reached in both 1932 and 1933. As noted above, total cropland used for crops also approached the peak acreage during the early years of the Great Depression, which began in October 1929. These acreage increases are notable because of the vast harm to farmers and the farm economy brought about by the Depression. One result was policy to reduce acres planted to corn, wheat and cotton, including the Agricultural Adjustment Act of 1933, the Soil Conservation and Domestic Allotment Act of 1936 and the Agricultural Adjustment Act of 1938.
Both total acres of cropland used for crops and total acres planted to the major commodities peaked again in 1981, at 387 million and 301 million, respectively. Total acres planted to the major crops increased from 269 million acres planted in 1975 to 294 million in 1980 and then the 301-million-acre peak in 1981. This second peak was the end of the era of substantially elevated acreage levels that began in the mid-1970s and is clear in Figure 1. Similarly, total cropland used for crops increased from 367 million in 1975 to 369 million acres in 1978, before reaching the 387 million acreage peak in 1981. The pattern of increased acres was also similar to the Great Depression; the acreage increases took place as the farm economic crisis deepened and worsened.
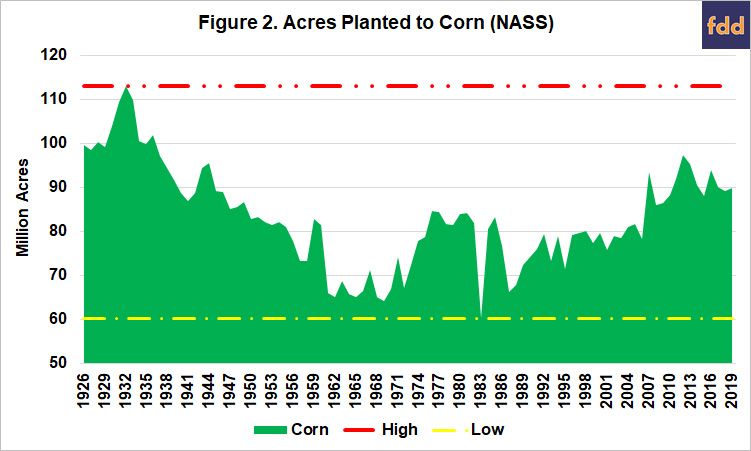
Looking closely at the historic peaks in Figure 1 leads to questions about specific crop acreage decisions by farmers in times of crises. Figures 2 and 3 illustrate the total acres planted to corn and wheat since 1926. Acres planted to corn in Figure 2 peaked at 113 million in 1932 but have not been above 100 million since 1936. The lowest level planted to corn was in 1983 when USDA’s Payment-in-Kind program removed nearly 80 million acres total, resulting in only 60 million acres planted to corn. The most recent peak was 97 million acres in 2012. The increased corn acreage following enactment of the Renewable Fuels Standard (RFS) in 2005 and 2007 also shows up clearly in Figure 2. Acres planted to corn averaged 89 million acres from 2005 to 2019.
Acres planted to wheat in Figure 3 are most notable for a peak in 1981 at 88 million acres and 1982 at 86 million acres. The only other high point for wheat acres was in 1949 at 84 million acres. The lowest level of acreage planted to wheat was in 2019 at 45 million acres. It was the third year in a row in which fewer than 50 million acres were planted to wheat. Wheat planted acreage has averaged 57 million acres since decoupling (1996 to 2019) and 54 million acres since the RFS (2005-2019).
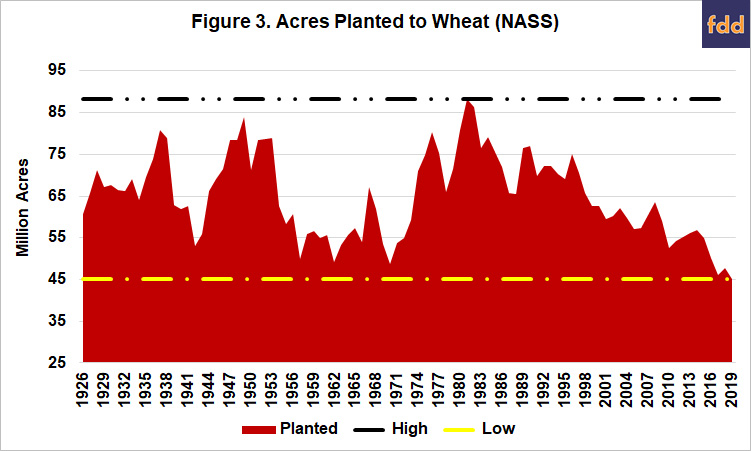
Figure 4 illustrates planted acres to cotton, soybeans and other feed grains in one chart to highlight the changes over time as compared to the peaks and valleys for acres planted to corn and wheat. First, the other feed grains (purple dash) is the combined acreage planted to barley, oats, rye and sorghum. Combined acreage for these crops peaked in 1955 at 93 million acres and again in 1957 at 90 million acres but total planted acres have declined substantially since that time; the lowest level planted was 10 million acres in 2019. The years 1954 through 1958 are also notable as the only years in which acres planted to the other feed grains exceeded acres planted to corn.
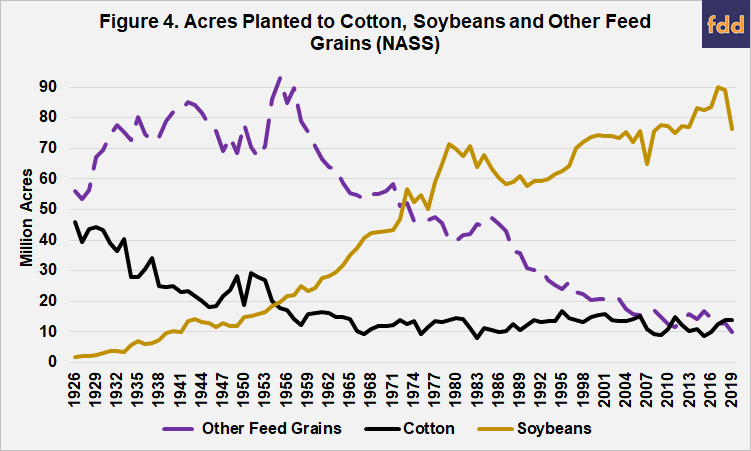
Acres planted to cotton (black line) have generally declined from the pre-Depression peak of 45 million acres planted in 1926; much of the decline the result of acreage allotment policies created in the New Deal and continued through the 1960s. By comparison, soybean acres (light brown line) move opposite of cotton and the other feed grains. The lowest level of soybean acres was 2 million acres from 1926 to 1930, but they have increased steadily since, likely indicating some amount of diversion of acres from those crops into soybeans. The peak for soybean acres was 90 million acres planted in 2017, followed by 89 million in 2018.
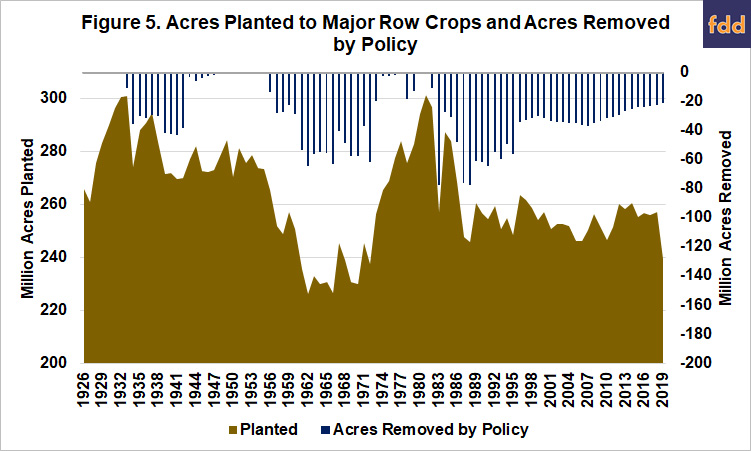
There is one other piece to the acreage discussion, the impact of policies designed specifically to address planted acres. Figure 5 illustrates the total acres planted to the major row crops and the acres removed from production or planting by policy. Acres removed by policy are indicated by the navy bars and work down from zero on the right-hand side. The brief history of acres removed by policy can be divided into the parity system of the 1930s, which used allotments to restrict planted acres of surplus crops. Next was the Soil Bank (1956 to 1958) which coincided with allotments for cotton and wheat but also removed additional acres in an acreage reserve and a conservation reserve program (farmdoc daily, February 20, 2020). It was followed by specific feed grains legislation in the 1960s that used Payment-in-Kind policy to encourage farmers to reduce acres planted to corn and the other feed grains (barley, oats, rye and sorghum). The impacts of those policies can also be clearly seen in Figure 4. Next, set-aside policy was used in the 1970s and 1980s but was terminated in the 1996 Farm Bill. Finally, the Conservation Reserve Program (CRP) was enacted in the Food Security Act of 1985. Since 1996 when farm program payments were decoupled from planting and set-aside authority ended, CRP has placed between 21 million acres (2019) and 37 million acres (2007) of environmentally-sensitive land under long-term conservation practices. From 1996 to 2019, CRP has averaged approximately 30.5 million acres.
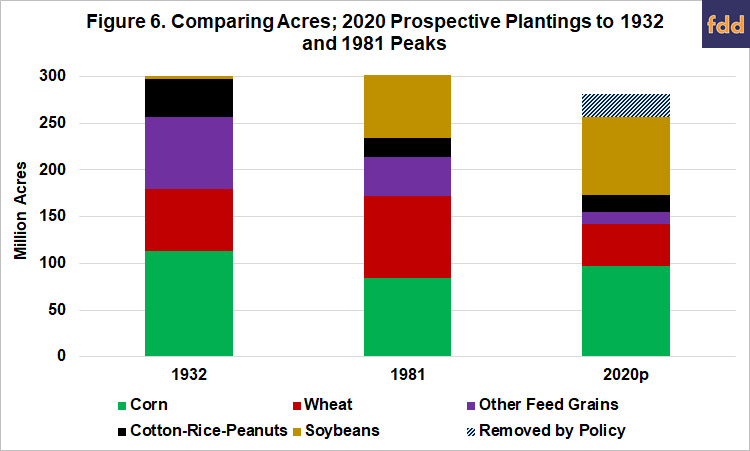
Finally, Figure 6 compares the 2020 prospective planted acres with the two previous peaks in 1932 and 1981 for corn, wheat, other feed grains (barley, oats, rye and sorghum), southern crops (cotton, rice and peanuts), soybeans and acres removed by policy. Notably, there was no policy to remove acres in 1932 and set aside acres were not used in 1981; CRP was not in place in 1981 either. The prospective plantings for these crops in 2020 total just under 257 million acres. For CRP in 2020, the fiscal year 2020 cap established by the 2018 Farm Bill is 24.5 million acres and that is the number of acres used in Figure 6. FSA recently reported that just over 3.4 million acres were accepted in signup 54. Combined, the acres planted and CRP equal 281 million acres, which is 20 million acres below the 1932 and 1981 peak planted acres.
Concluding Thoughts
Reviewing the history for acres in farm production, as measured by total acres planted to major row crops, offers perspective for consideration in this current pandemic and the economic crisis expect to result. Planted acres increased in the early years of the two most significant economic crises for farmers, in the early years of the Great Depression and as the 1980s farm crisis developed. During each of these eras, corn and wheat were the largest drivers of the acreage increases. The historic policy response has been mechanisms for encouraging farmers to plant less. Three major policy changes in the last 30 years are also important to keep in mind: the Conservation Reserve Program created in 1985; decoupling and the end of set-aside policy in 1996; and the Renewable Fuels Standard beginning in 2005. Since at least 1996, corn and soybeans have been the largest crops in terms of acres planted and they have been the predominate drivers of increases or decreases in overall acres in production. USDA’s Prospective Plantings report offers an early prediction that farmers may increase planted acres of corn (97 million) and soybeans (83.5 million) compared to 2019 but that total planted acres are well below earlier peaks; approximately 20 million acres remain unaccounted for by either prospective plantings or CRP.
References
Coppess, J. "The Conservation Question, Part 7: Losing the Soil Bank." farmdoc daily (10):31, Department of Agricultural and Consumer Economics, University of Illinois at Urbana-Champaign, February 20, 2020.
Hubbs, T. "Implications of 97 Million Corn Acres." farmdoc daily (10):63, Department of Agricultural and Consumer Economics, University of Illinois at Urbana-Champaign, April 6, 2020.
Disclaimer: We request all readers, electronic media and others follow our citation guidelines when re-posting articles from farmdoc daily. Guidelines are available here. The farmdoc daily website falls under University of Illinois copyright and intellectual property rights. For a detailed statement, please see the University of Illinois Copyright Information and Policies here.