Farm Program Update: ARC/PLC Enrollment
The Farm Service Agency (FSA) recently released enrollment data for the Agriculture Risk Coverage (ARC) and Price Loss Coverage farm bill programs. This article reviews the new enrollment data, compares it to the 2014 farm program enrollment, and discusses expected payment considerations that have emerged as a result of price declines associated with the Covid-19 pandemic.
Background
The Agricultural Improvement Act of 2018 continued the basic payment programs created in the 2014 Farm Bill: Agricultural Risk Coverage, county (ARC-CO) and individual (ARC-IC), as well as Price Loss Coverage (PLC). Farmers elected either ARC-CO or PLC for each program crop with base acres on the farm; alternatively, ARC-IC could be elected as an option for all program crops with base on the farm. Farmers were able to make a program election for the covered commodities with base acres on each FSA farm. The election covers the 2019 and 2020 crop years. Farmers will have an opportunity to revisit the election for the 2021 crop year.
Discussion
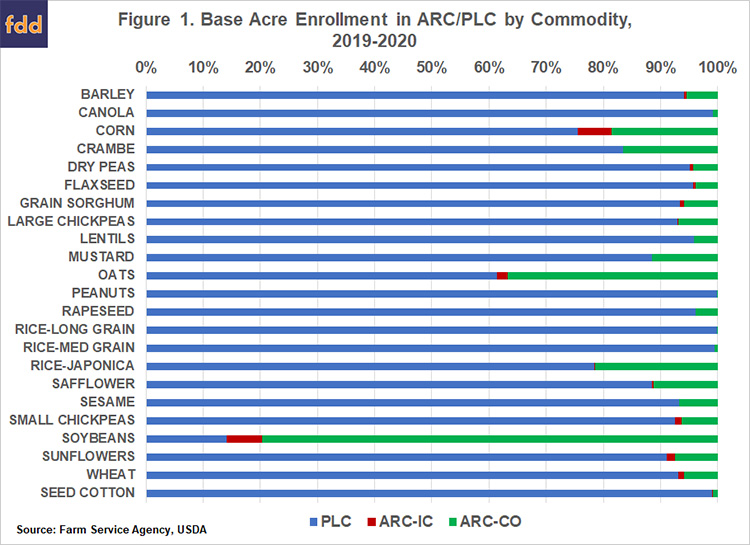
Figure 1 illustrates the enrollment data for the 2019 and 2020 crop years as reported by FSA. Specifically, 75.5% of corn base acres were enrolled in PLC, while almost 19% were enrolled in ARC-CO; almost 6% of corn base acres were in the ARC-IC program. By comparison, nearly 80% of soybean base acre were enrolled in ARC-CO and 14% in PLC, while 6% of soybean acres were also enrolled in ARC-IC. Corn and soybeans having the highest relative enrollment in ARC-IC may be attributed to the large number of prevent plant acres for those crops in 2019, and the fact that they are grown in rotation on acres with historical corn and soybean base (see, farmdoc daily, February 11, 2020).
By comparison, the enrollment for the 2014 farm bill (Figure 2) versions of these programs showed much heavier participation in ARC-CO for corn base (94%) and soybean base (97%), while wheat base acres were largely split, with 56% in ARC-CO, 42% in PLC and 2% in ARC-IC (farmdoc daily, July 16, 2015).


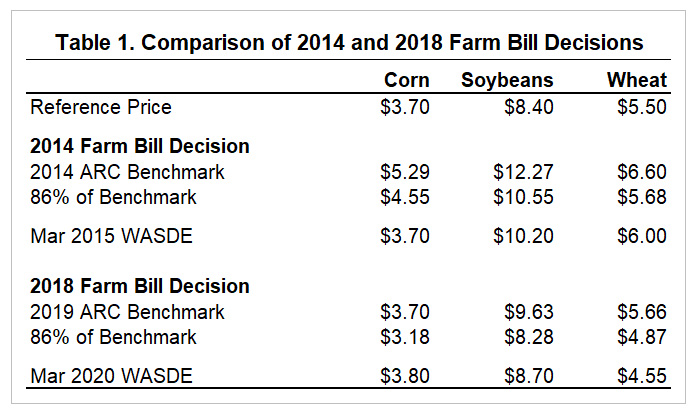
The shift in enrollment towards PLC for most of the major program commodities reflects the different price environments for the 2014 and 2018 farm bill decision periods. In 2014, relatively high prices for the preceding five marketing years resulted in ARC-CO benchmark prices well above the PLC reference prices for corn, soybeans, and wheat (see Table 1). The March 2015 WASDE season average price forecasts suggested corn and soybean prices that were likely to trigger ARC-CO payments, coming in well below the ARC-CO price benchmarks for 2014 and also below 86% of the benchmark – the point at which low prices would trigger ARC-CO payments even without county yield losses. This resulted in heavy enrollment in ARC-CO for both corn and soybean base (93% and 97% of base acres, respectively). The situation for wheat was more of a statistical coin-toss in terms of which program might be likely to trigger payments, with the season average price forecast of $6.00 being above both the PLC reference price and 86% of the ARC benchmark price; enrollment of wheat base acres was split relatively evenly between ARC and PLC.

For the 2018 farm bill decision, lower prices from 2013 to 2017 resulted in ARC benchmark prices for 2019 that were much lower than in 2014; in the case of corn, prices were projected to be close to the reference price, while for wheat prices were below the $5.50 reference. Comparing the March 2020 WASDE projections to PLC reference prices and 2019 ARC benchmark prices resulted in estimate payments that leaned towards PLC for both corn and wheat base acres in most areas of the country. Enrollment numbers align with these recommendations, with 76% of corn base and 93% of wheat base electing PLC for 2019 and 2020.
For soybeans, the price projections throughout the few months leading up to the March enrollment deadline remained above both the PLC reference price and 86% of the ARC benchmark. Payment estimates—based on size of payments and probability for payments, such as those provided by the Gardner-farmdoc payment calculator—pointed toward ARC-CO for soybeans in many areas based on 2019 yield estimates but there were county-level cases where PLC might be expected to generate larger payments over the two-year period covered by the election. Soybeans are the single program commodity with a majority of acreage enrolled in ARC-CO (80%) versus PLC (14%).
In just a few (admittedly long-feeling) weeks, the coronavirus pandemic has altered the scenarios for the 2019/20 and 2020/21 marketing year average prices used to calculate payments for the ARC and PLC programs. The most recent forecasts of 2019/20 season average prices from the Economic Research service (updated 4/9/2020) suggested prices of $3.55 for corn, $8.58 for soybeans, and $4.60 for wheat. Futures markets movements over the past three weeks would suggest forecasts moving below $3.50 for corn, approaching $8.50 for soybeans, and remaining close to $4.60 for wheat.
These movements tend to reinforce recommendations of PLC for corn and wheat based on payment expectations for the 2019 program year at these price levels. Recommendations for soybeans at the lower forecast of around $8.50 are also likely similar to what would have been elected based on the $8.70 expectation in early March; the soybean reference price is $8.40 per bushel with prices forecasted to remain above it. At the lower price forecasts for corn and soybeans, the likelihood of payments from either the PLC or ARC programs would tend to increase along with the potential size of payments.
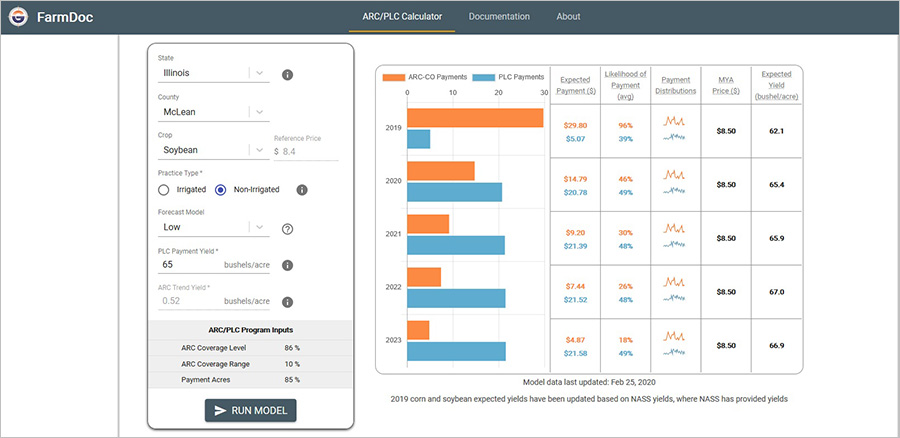
For readers interested in impacts of current prices on expected program payments levels, the Gardner-farmdoc payment calculator (https://fd-tools.ncsa.illinois.edu/arcplc) has been updated to include lower price scenarios and the resulting payment estimates. The following are examples for corn and soybeans in McLean County, Illinois based on the new low price scenarios ($3.40 for corn; $8.50 for soybeans).


Concluding Thoughts
Much remains unknown and incredibly uncertain for the economy in the wake of this pandemic, including for corn and soybean prices. The 2019-2020 farm program enrollment data from FSA reflects the drastically changed price expectations, especially for corn and wheat, as compared to the 2014 farm bill enrollment. The pandemic’s impact on prices reinforce this decision, likely triggering PLC payments for corn and ARC-CO payments for soybeans, but much remains to be learned in this marketing year.
References
Schnitkey, G., B. Brown, K. Swanson, C. Zulauf, N. Paulson and J. Coppess. "Strategies for Using ARC-IC." farmdoc daily (10):25, Department of Agricultural and Consumer Economics, University of Illinois at Urbana-Champaign, February 11, 2020.
Schnitkey, G., J. Coppess, N. Paulson and C. Zulauf. "Perspectives on Commodity Program Choices Under the 2014 Farm Bill." farmdoc daily (5):111, Department of Agricultural and Consumer Economics, University of Illinois at Urbana-Champaign, June 16, 2015.
Disclaimer: We request all readers, electronic media and others follow our citation guidelines when re-posting articles from farmdoc daily. Guidelines are available here. The farmdoc daily website falls under University of Illinois copyright and intellectual property rights. For a detailed statement, please see the University of Illinois Copyright Information and Policies here.


