Soybeans and PLC: Example of the Need for Better Equity among Program Crops
This article examines the reference price for soybeans. It is sparked in part by soybeans being only one of only 5 covered commodities that received no payment from the Price Loss Coverage (PLC) program under the 2014 Farm Bill. The other 4, like soybeans, are oilseeds: crambe, mustard, sesame, and small chickpeas. The other 4, unlike soybeans, now have higher reference prices due to the 2018 Farm Bill (see Data Note 1). Three different analyses all point to the same conclusion: compared with other covered commodities, soybean’s reference price is set low relative to market prices.
Background on Procedure
Two observations underpin the procedure used in this study.
- PLC makes payments when market price is less than the reference price. Thus, one estimate of PLC’s potential to make future payments is to compare the reference price to an average of historical prices. In general, the higher is a crop’s reference price relative to the crop’s average historical price, the more likely PLC will make payments.
- Crops have long-term price relationships that reflect the interplay of their supply and demand factors. To illustrate, probably the most watched relationship is between corn and soybean prices. They are the two largest acreage US field crops and can be planted on many of the same US acres. The ratio of US soybean-to-corn market year price has averaged 2.50 since 1975. Its range however is large: 1.94 (1988) to 3.19 (1975). The large range illustrates how much short-term relationship can deviate from its long-term relationship, which in turn implies the importance of examining both long-term and short-term relationships when assessing policy.
1975-2018 Prices
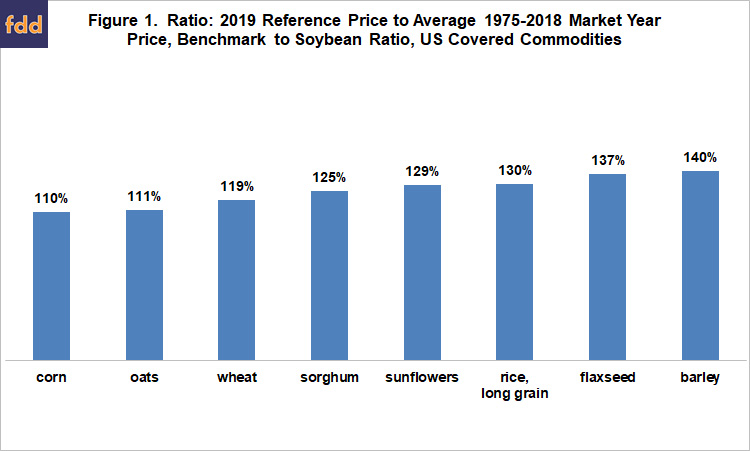
The first analysis involves covered commodities that have market year prices for all years back to 1975. This is a long span of 45 years that follows the dramatic price increase of the early 1970s. It includes periods of low prices and returns, two periods of farm prosperity, and various farm program designs. Since soybeans is the crop of interest, the ratio is benchmarked to the ratio for soybeans by dividing the crop’s ratio by soybean’s ratio. A ratio of 100% means the ratio of 2019 reference price to 1975-2018 market year price is the same for the crop and soybeans. Ratios above 100% mean that that crop is more likely to receive PLC payments relative to soybeans.
Eight current covered commodities have market year prices back to 1975 (see Data Note 2). All 8 ratios exceed 100% (see Figure 1). The range is 110% (corn) to 140% (barley). Reference price is higher relative to market price for all 8 of these crops than for soybeans. The ratio also tells us how much the soybean reference price needs to increase for the ratio to be 100%. For example, the soybean reference price would need to be 10% or $0.84/bushel higher for corn and soybeans to have the same relationship between 2019 reference price and 1975-2018 market year price.

1991-2018 Oilseed Prices
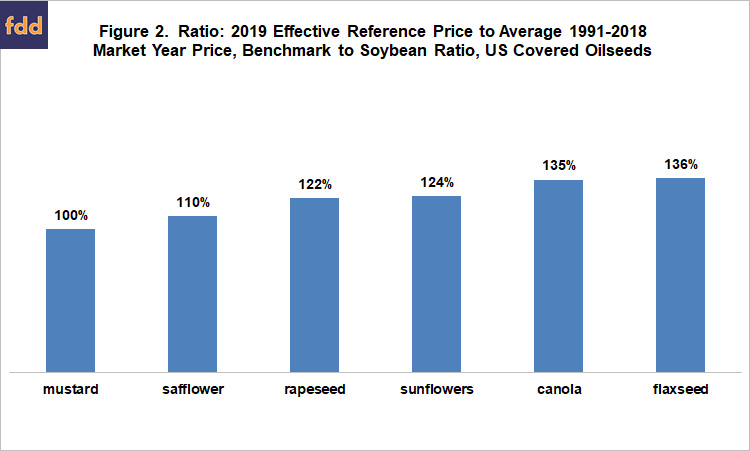
Soybeans is an oilseed crop. Thus, a reasonable comparison is relative to other oilseeds. Prices for flaxseed and sunflowers extend back to 1975 (see Figure 1), but prices for other oilseeds do not become available until 1991. Prices for 6 oilseeds that are covered commodities exist for 1991 on. The same ratio is calculated as in Figure 1. The range is from 100% for mustard to 136% for flaxseed (see Figure 2). The ratios for flaxseed are nearly the same in both figures, but differ somewhat for sunflowers. While not substantive, the latter difference illustrates the desirability of cross-checking historical analyses using different time periods. Of the 12 covered commodities in Figures 1 and 2, only mustard has a ratio less than 110%.

Projected 2019 PLC Payments
The final analysis is short-term in nature. It uses a data file that contains effective reference prices and market year price estimates for 2019 crops of the 23 covered commodities. It is updated monthly by the US Department of Agriculture, Farm Service Agency. The latest update is May 2020 following release of May’s World Agricultural Supply and Demand Estimates (WASDE). Only 6 covered commodities are projected to receive no PLC payment in 2019. Soybeans is one of them. The other 5 are mustard, oats, safflower, sesame, and temperate Japonica rice.
Differential Importance by State
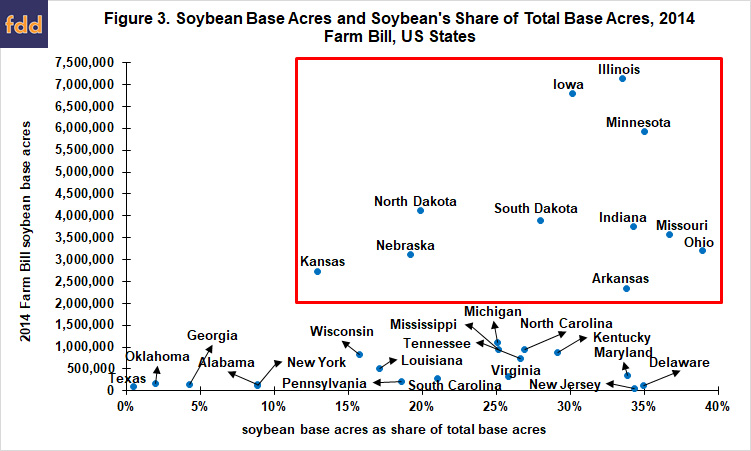
Importance of soybean’s low reference price relative to market price is not uniform across the US. States very widely in the importance of soybean base acres. The red box in Figure 3 contains the states with more than 2 million acres of soybean base and more than 10% of total base acres in soybeans. Illinois, Iowa, and Minnesota stand out. Ohio, Missouri, Indiana, and Arkansas have as large or larger share of base acres in soybeans.

Summary Observations
This study suggests that, compared to the majority of other covered program commodities, the soybean reference price may be set at least 10% too low relative to market prices. Note, this is a relative statement. It is possible the soybean reference price is set appropriately and other reference prices are set too high or that the other reference prices are set appropriately and soybean’s reference price is set too low.
As soybean prices have worked their way lower in recent years; a potential hole has opened up in the farm safety net. Soybeans receive little assistance to offset the lower prices since its reference price is set lower relative to market price than most other covered commodities.
Impact of the lower relative support for soybeans is not distributed uniformly across the US because the importance of soybean base acres varies widely across states. Importance of soybean base acres and thus the lower relative support for soybeans is concentrated in Corn Belt states plus Arkansas.
The potential hole in the safety net suggests the need to discuss whether reference prices should be rebalanced across program commodities. If budgetary pressures are constraining, rebalancing likely means a reduction in the reference prices for other covered commodities, producing a nasty debate among farm groups.
Another approach is to continue to enact ad hoc payments that disproportionately target soybeans, as the 2018 Market Facilitation Program did (American Farm Bureau Federation, 2019), until soybean prices increase. Rationale for large ad hoc payments to soybeans is to compensate for the low payments from existing commodity programs.
Ad hoc payments are often criticized as politically inspired gifts or attempts to “buy votes.” But, ad hoc payments can also have strong, economically based rationales related to holes in the safety net. Careful consideration of all potential explanations for ad hoc payments is in order, particularly if the goal is a fair, equitable safety net.
A third approach that the US could take is to design a new safety net that is more equitable across program crops and regions of the US.
Which approach is taken depends upon many factors, but the price of soybeans could be a key and may turn out to be the most important driver.
Data Notes
- The 2018 Farm Bill authorized the concept of “effective reference price.” It was defined as the higher of (a) the statutory reference price specified in the farm bill or (b) a reference price escalator equal to 85% of the Olympic average (removes high and low values) of a covered commodity’s 5 most recent US market year prices, but (c) capped at 115% of its statutory reference price. The reference price escalator resulted in the 2019 reference price for crambe, mustard, sesame, and small chickpeas all increasing by the 15% maximum. The escalator also raised the 2019 reference price for large chickpeas (+15%), lentils (+12%), and small chickpeas (+8%). For more discussion of the reference price escalator, see the February 21, 2019 farmdoc daily article by Zulauf, Coppess, Schnitkey, Paulson, and Swanson.
- Peanut prices are available back to 1975, but peanuts had a marketing quota program until the 2002 Farm Bill eliminated it. Marketing quotas raise price above private market clearing levels, resulting in an apples-and-oranges comparison relative to the other crops in Figure 1.
References and Data Sources
American Farm Bureau Federation. 2019. “Mapping the $8.5 Billion in Trade Assistance: Reviewing MFP Payments by Commodity and State.” Market Intel. June 12, 2020. Available online: https://www.fb.org/market-intel/mapping-8.5-billion-in-trade-assistance
The National Agricultural Law Center. 2020. Copies of all U.S. farm bills. July. Available online: http://nationalaglawcenter.org/farmbills/
US Department of Agriculture, Farm Service Agency. May 2020. “ARC/PLC Program.” https://www.fsa.usda.gov/programs-and-services/arcplc_program/index
Zulauf, C., J. Coppess, G. Schnitkey, N. Paulson and K. Swanson. “2018 Farm Bill Reference Price Escalator for 2019 Market Year.” farmdoc daily (9):31, Department of Agricultural and Consumer Economics, University of Illinois at Urbana-Champaign, February 21, 2019.
Disclaimer: We request all readers, electronic media and others follow our citation guidelines when re-posting articles from farmdoc daily. Guidelines are available here. The farmdoc daily website falls under University of Illinois copyright and intellectual property rights. For a detailed statement, please see the University of Illinois Copyright Information and Policies here.


