


Revenue Loss Coverage and Other Farm Safety Net Proposals in an Era of High Ad Hoc Payments
In a farmdoc daily article of July 29, 2020; Zulauf, Schnitkey, Coppess, Paulson, and Swanson observe that high ad hoc farm payments have historically signaled increased spending on the farm safety net in the next farm bill. Ad hoc payments have 3 policy-related motivations:
- The current safety net assistance for current program commodities is viewed as inadequate,
- current non-program commodities are viewed as needing assistance, and
- current safety net assistance is viewed as not timely.
A new Revenue Loss Coverage (RLC) commodity program is discussed. It can address motivations 1 and 2. RLC blends into a single program the revenue design of ARC (Agriculture Risk Coverage) with the reference price and US orientation of PLC (Price Loss Coverage). Also discussed are a 10% higher soybean’s reference price (motivation 1) and conditional, partial early payment (motivation 3).
RLC: Initial motivation for RLC was to free up time and resources that farms and FSA (Farm Service Agency) devote to program choice. RLC creates a single program by specifying a target revenue that combines ARC’s trend yield with PLC’s reference price, while allowing support price to move higher if market price exceeds the reference price (see Data Note 1). Assistance is provided when US revenue per planted acre is below a target revenue. Specifically, RLC’s payment rate per planted acre is:
MAX [0, (US trend yield per planted acre ● MAX (reference price, 86% ● 5 year Olympic average price) – (US yield per planted acre ● US market year average price)} ● 85%
Payment rate is the same for all farms, but can be made farm specific by multiplying the US payment rate by a ratio of farm-to-US yield.
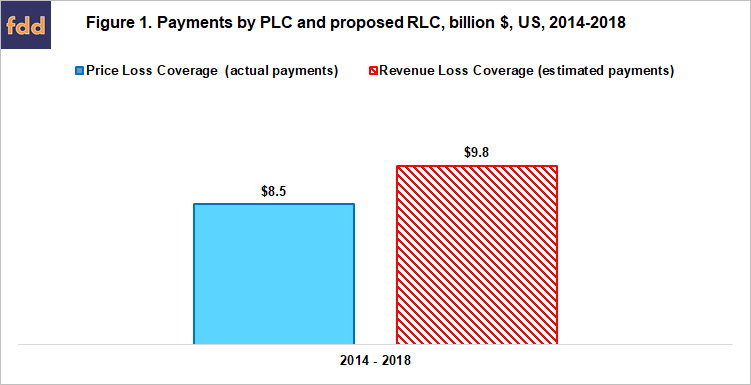
Using base acres enrolled in PLC during the 2014 farm bill sign up and a 93% budget sequestration, payments by RLC are estimated to be 15% higher than actual PLC payments to 2014-2018 barley, canola, corn, oats, peanuts, long-grain rice, sorghum, soybeans, sunflowers, and wheat (see Figure 1 and Data Note 2). These crops accounted for 99% of 2014 farm bill PLC payments (see Data Notes 3 and 4). PLC is used as the comparison program because it was elected for 70% of all US base acres during program sign up for 2019. RLC payments also had a higher association with lower net returns (see Data Note 5). RLC would thus have been more effective at reducing net return risk when a base acre was planted to the same crop. Note that RLC can be budget neutral with respect to PLC by reducing the current 85% payment factor.
Soybean Reference Price: Initial motivation for this proposal was the July 8, 2020 farmdoc daily article which documents that, compared to almost all other program crops, soybean’s reference price is low relative to market price. This finding raises a fairness issue that can be addressed by increasing the soybean reference price or reducing the reference price for other program commodities. This article discusses the former approach. Soybean’s reference price for 2019 would need to be 10% higher for it to have the same relationship as corn’s 2019 reference price has to long-term average market price for 1975-2018 (Zulauf, et al., July 8, 2020). At $9.24, or a 10% higher reference price; RLC payments to 2019 soybeans are estimated to be $2.0 billion assuming all base acres are in RLC. At the current $8.40 reference price, RLC payments are estimated at $0.3 billion. PLC made no payment to 2018 soybeans and likely will make no payment to 2019 soybeans (USDA, FSA) (see Data Note 6). In comparison, MFP (Market Facilitation Program) made $7 billion in payments to 2018 soybeans (American Farm Bureau Federation) and likely more than $5 billion in payments to 2019 soybeans (estimated based on data at USDA (US Department of Agriculture), Farmers.gov, August 10, 2020b).
Expanded Program Commodities: RLC’s payment rate formula can be applied to any commodity for which Congress establishes a reference price and USDA collects market year price and production per base input unit (yield per acre for crops and the analogous output per livestock breeding unit). This adaptability is desirable because expanding the list of program commodities is likely to be an issue in the next farm bill. Non-program commodities receiving ad hoc payments increased from 3 in MFP 2018, to 15 in MFP 2019, to more than 90 in CFAP (Coronavirus Food Assistance Program) 2020 (see Data Note 7). Moreover, a recent policy trend is to add commodities to the farm bill (Zulauf and Orden). Notably, the 2008 farm bill designated dry peas, lentils, and small and large chickpeas as program commodities and authorized a Supplemental Disaster Assistance Program for livestock, honeybees, farm-raised catfish, orchard trees, and nursery stock. Funding for the latter was made permanent in the 2014 farm bill.
Earlier Payment: ARC and PLC payments are not made until next fall’s harvest. Some, but not recent farm bills permitted partial, earlier payment. Early payment share was small because it is politically unappealing to collect refunds, which will occur if early payment exceeds final payment. Refunds still occurred, primarily because the volatility of farm prices can result in a small, even moderate projected payment being eliminated. We therefore propose to reinstitute early payments but limit them to years when high payments are projected, for example when per unit payment exceeds 5% of projected market year price. These are years assistance is likely most needed, making early payment desirable. Moreover, applying a small, even moderate early payment share to a large projected payment further reduces the potential for a refund.
Concluding Observation
Ad hoc payments can indicate that policy makers believe the existing safety net is not performing acceptably. Three general policy-related motivations for ad hoc payments are identified. Proposals are offered to address each motivation. These proposals are not the only potential proposals and the proposals’ version discussed in this article are not the only versions. However, the approach used in this article of relating a proposal to how it reduces the motivation for ad hoc payments will likely be useful to policy makers in the next farm bill debate.
Data Notes
- Both ARC’s and PLC’s support price can increase above the farm bill’s statutory reference price. ARC’s price can be thought of as, 86% of a 5-year Olympic average (excludes high and low) of recent market year prices, with the reference price as a minimum. The 2018 farm bill authorized an escalator option for the reference price, which is PLC’s payment price. The escalator is 85% of an Olympic average of the 5 most recent crop year prices, but capped at 115% of the statutory reference price. The escalator is discussed further in a farmdoc daily article of February 21, 2019.
- Trend yield is an in-sample estimate obtained from a linear regression of planted yield observed for the 1991-2019 crops. The analysis starts with 1991 because this is the first year data are available for canola. Except for oats, planted yield equals US production divided by US acres planted to the crop in that year. Yield per harvested acre is used for oats because a small share of acres planted to oats are harvested for grain. This share was 29% for 2019. Silage acres are subtracted from acres planted to corn and sorghum. Non-harvested acres of corn and sorghum acres are thus assumed to have been planted for harvest as grain.
- Because of changes to the program for cotton, the 99% share excludes payments to 2014-2017 generic base and 2018 seed cotton. Generic base were cotton base acres in the 2008 farm bill.
- RLC payments were expected to be higher in general. Exceptions for individual crops were also expected given the limited analysis period of 5 years and the role of short term factors, such as weather. One reason for these expectations is that, at the US level, variability of price and revenue are nearly the same for 9 of the 10 crops in this study. The exception is rice. Standard deviation of year-to-year percent change over 1991-2019 averaged 19% for market year price and 20% for revenue per acre for the 9 crops. For long grain rice, the respective values were 18% and 5%. A second reason is that US trend yield used in RLC is higher than the average historical PLC yield. RLC payments were higher for 7 of the 10 crops, including rice. Exceptions were sorghum, soybeans, and sunflowers. Yields were highest for these crops, averaging 12%, 6%, and 5% higher than trend yield, respectively. Yields exceeded trend in all years for sorghum and soybeans and all but 2014 for sunflowers. High yields reduce RLC payments, assuming other factors remain the same. Soybeans received no payment from either program over 2014-2018.
- Average correlation between US net return per acre and average RLC payment per base acre was -0.50 for 2014-2018 corn, peanuts, sorghum, and wheat. The same correlation for PLC was -0.30. Net return is from USDA, Economic Research Service cost of production data.
- At a $9.24 reference price, PLC payments are estimated to be $1.3 billion using the highest soybean base yield (40.8 bushels / acre) reported in the 2014 farm bill sign up data (USDA, FSA).
- Non-program commodities in MFP 2018 were hogs, fresh sweet cherries, and shelled almonds (American Farm Bureau Federation). In MFP 2019 they were alfalfa hay, almonds, cranberries, cultivated ginseng, fresh grapes, fresh sweet cherries, hazelnuts, hogs, macadamia nuts, millet, pecans, pistachios, rye, triticale, and walnuts (USDA, Farmers.gov, August 10, 2020b). In CFAP 2020, they are cattle, hogs, millet, sheep, and wool, plus more than 80 specialty crops (USDA, Farmers.gov, August 10, 2020a).
References and Data Sources
American Farm Bureau Federation. June 12, 2019. “Mapping the $8.5 Billion in Trade Assistance: Reviewing MFP Payments by Commodity and State.” Market Intel. Available online: https://www.fb.org/market-intel/mapping-8.5-billion-in-trade-assistance
The National Agricultural Law Center. July 2020. Inventory of all US farm bills. Available online: http://nationalaglawcenter.org/farmbills/
US Department of Agriculture, Economic Research Service. June 2020. Commodity Costs and Returns. https://www.ers.U.S.da.gov/data-products/commodity-costs-and-returns.aspx
US Department of Agriculture, Farm Service Agency. August 2020. “ARC/PLC Program.” https://www.fsa.usda.gov/programs-and-services/arcplc_program/index
US Department of Agriculture, Farmers.gov. August 10, 2020a. Coronavirus Food Assistance Program. https://www.farmers.gov/cfap
US Department of Agriculture, Farmers.gov. August 10, 2020b. Market Facilitation Program. https://www.farmers.gov/manage/mfp
Zulauf, C., J. Coppess, G. Schnitkey, N. Paulson and K. Swanson. “2018 Farm Bill Reference Price Escalator for 2019 Market Year.” farmdoc daily (9):31, Department of Agricultural and Consumer Economics, University of Illinois at Urbana-Champaign, February 21, 2019.
Zulauf, C., G. Schnitkey, J. Coppess, N. Paulson, K. Swanson “Soybeans and PLC: Example of the Need for Better Equity among Program Crops.” farmdoc daily (10):125, Department of Agricultural and Consumer Economics, University of Illinois at Urbana-Champaign, July 8, 2020.
Zulauf, C. and D. Orden. 4th Quarter 2016. 80 Years of Farm Bills: Evolutionary Reform. Choices: Online Magazine. Included in article theme, “Looking Ahead to the Next Farm Bill.” Agricultural and Applied Economics Association. Available online: http://www.choicesmagazine.org.
Zulauf, C., G. Schnitkey, J. Coppess, N. Paulson and K. Swanson. “Ad Hoc Payments: A Leading Indicator of Farm Policy Change.” farmdoc daily (10):140, Department of Agricultural and Consumer Economics, University of Illinois at Urbana-Champaign, July 29, 2020.
Disclaimer: We request all readers, electronic media and others follow our citation guidelines when re-posting articles from farmdoc daily. Guidelines are available here. The farmdoc daily website falls under University of Illinois copyright and intellectual property rights. For a detailed statement, please see the University of Illinois Copyright Information and Policies here.