


IFES 2021: Factors affecting Farmland Values and Rental Rates
This is a presentation summary from the 2021 virtual Illinois Farm Economics Summit (IFES). A video of the webinar and PowerPoint Slides (PDF) are available here.
Farmland Markets Background
Farmland values have experienced a remarkable surge across much of the country during the last 9 to 12 months with values in many areas in the corn belt up more than 20% during that period. Farmland lease rates also experienced upward pressures heading into 2022 that represented the highest percentage increases in nearly a decade. Farmers had strong incomes in 2021 driven by increased commodity prices, which were supported by increased export demand and recovering domestic usage as well. Farmland, like other real assets, had values that were also supported by sustained low interest rates and attendant high income multiples while maintaining prospects for ongoing price appreciation.
In last year’s IFES presentation, it was noted that factors affecting incomes would largely determine near-term price performance and that longer term valuation would depend critically on capital market and interest rate impacts as well. The reasonably positive projections from a year ago have in fact turned out to be mostly accurate, and the strong market for farmland that developed since then has continued into the fourth quarter, which is traditionally a strong period for farmland markets. Amplification of market pressure has occurred in the form of heightened inflation concerns, and debate about future monetary policy and stimulus spending. Carbon-payment potential, and early signals around eco-service payments have begun arriving as well along with a view that agricultural production is part of a larger climate solution strategy due to the potential for carbon sequestration. Unfortunately, disruptions related to the COVID-19 pandemic and associated policy responses have continued longer than expected as well.
Farmland Markets – How Did We Get Here and Where Are We Going?
Farmland values are determined by a complex set of factors that include income and income prospects, options for combining tracts within an operation, future development potential, and so forth, but most of all by productivity. Cropland is typically subdivided into annual row-crop production (e.g., corn, soybeans) and permanent crops (e.g., citrus, tree nuts, wine grapes). USDA publishes the results of its annual survey of land values and lease rates by category along with related information about acreage and use changes, and the National Council of Real Estate Investment Fiduciaries (NCREIF) provides complementary information on a quarterly basis on performance of institutionally owned and professionally managed agricultural assets. Figure 1 shows 2021 average cropland values by state, and Figure 2 shows the percentage change in value from one year ago. Since the release of the updated USDA data, regional surveys in the Midwest in particular have shown an even more rapid increase in the second half of 2021 with transactional evidence that the total farmland percentage increases in values were roughly double or slightly more than double the midyear percentages shown in Figure 2.
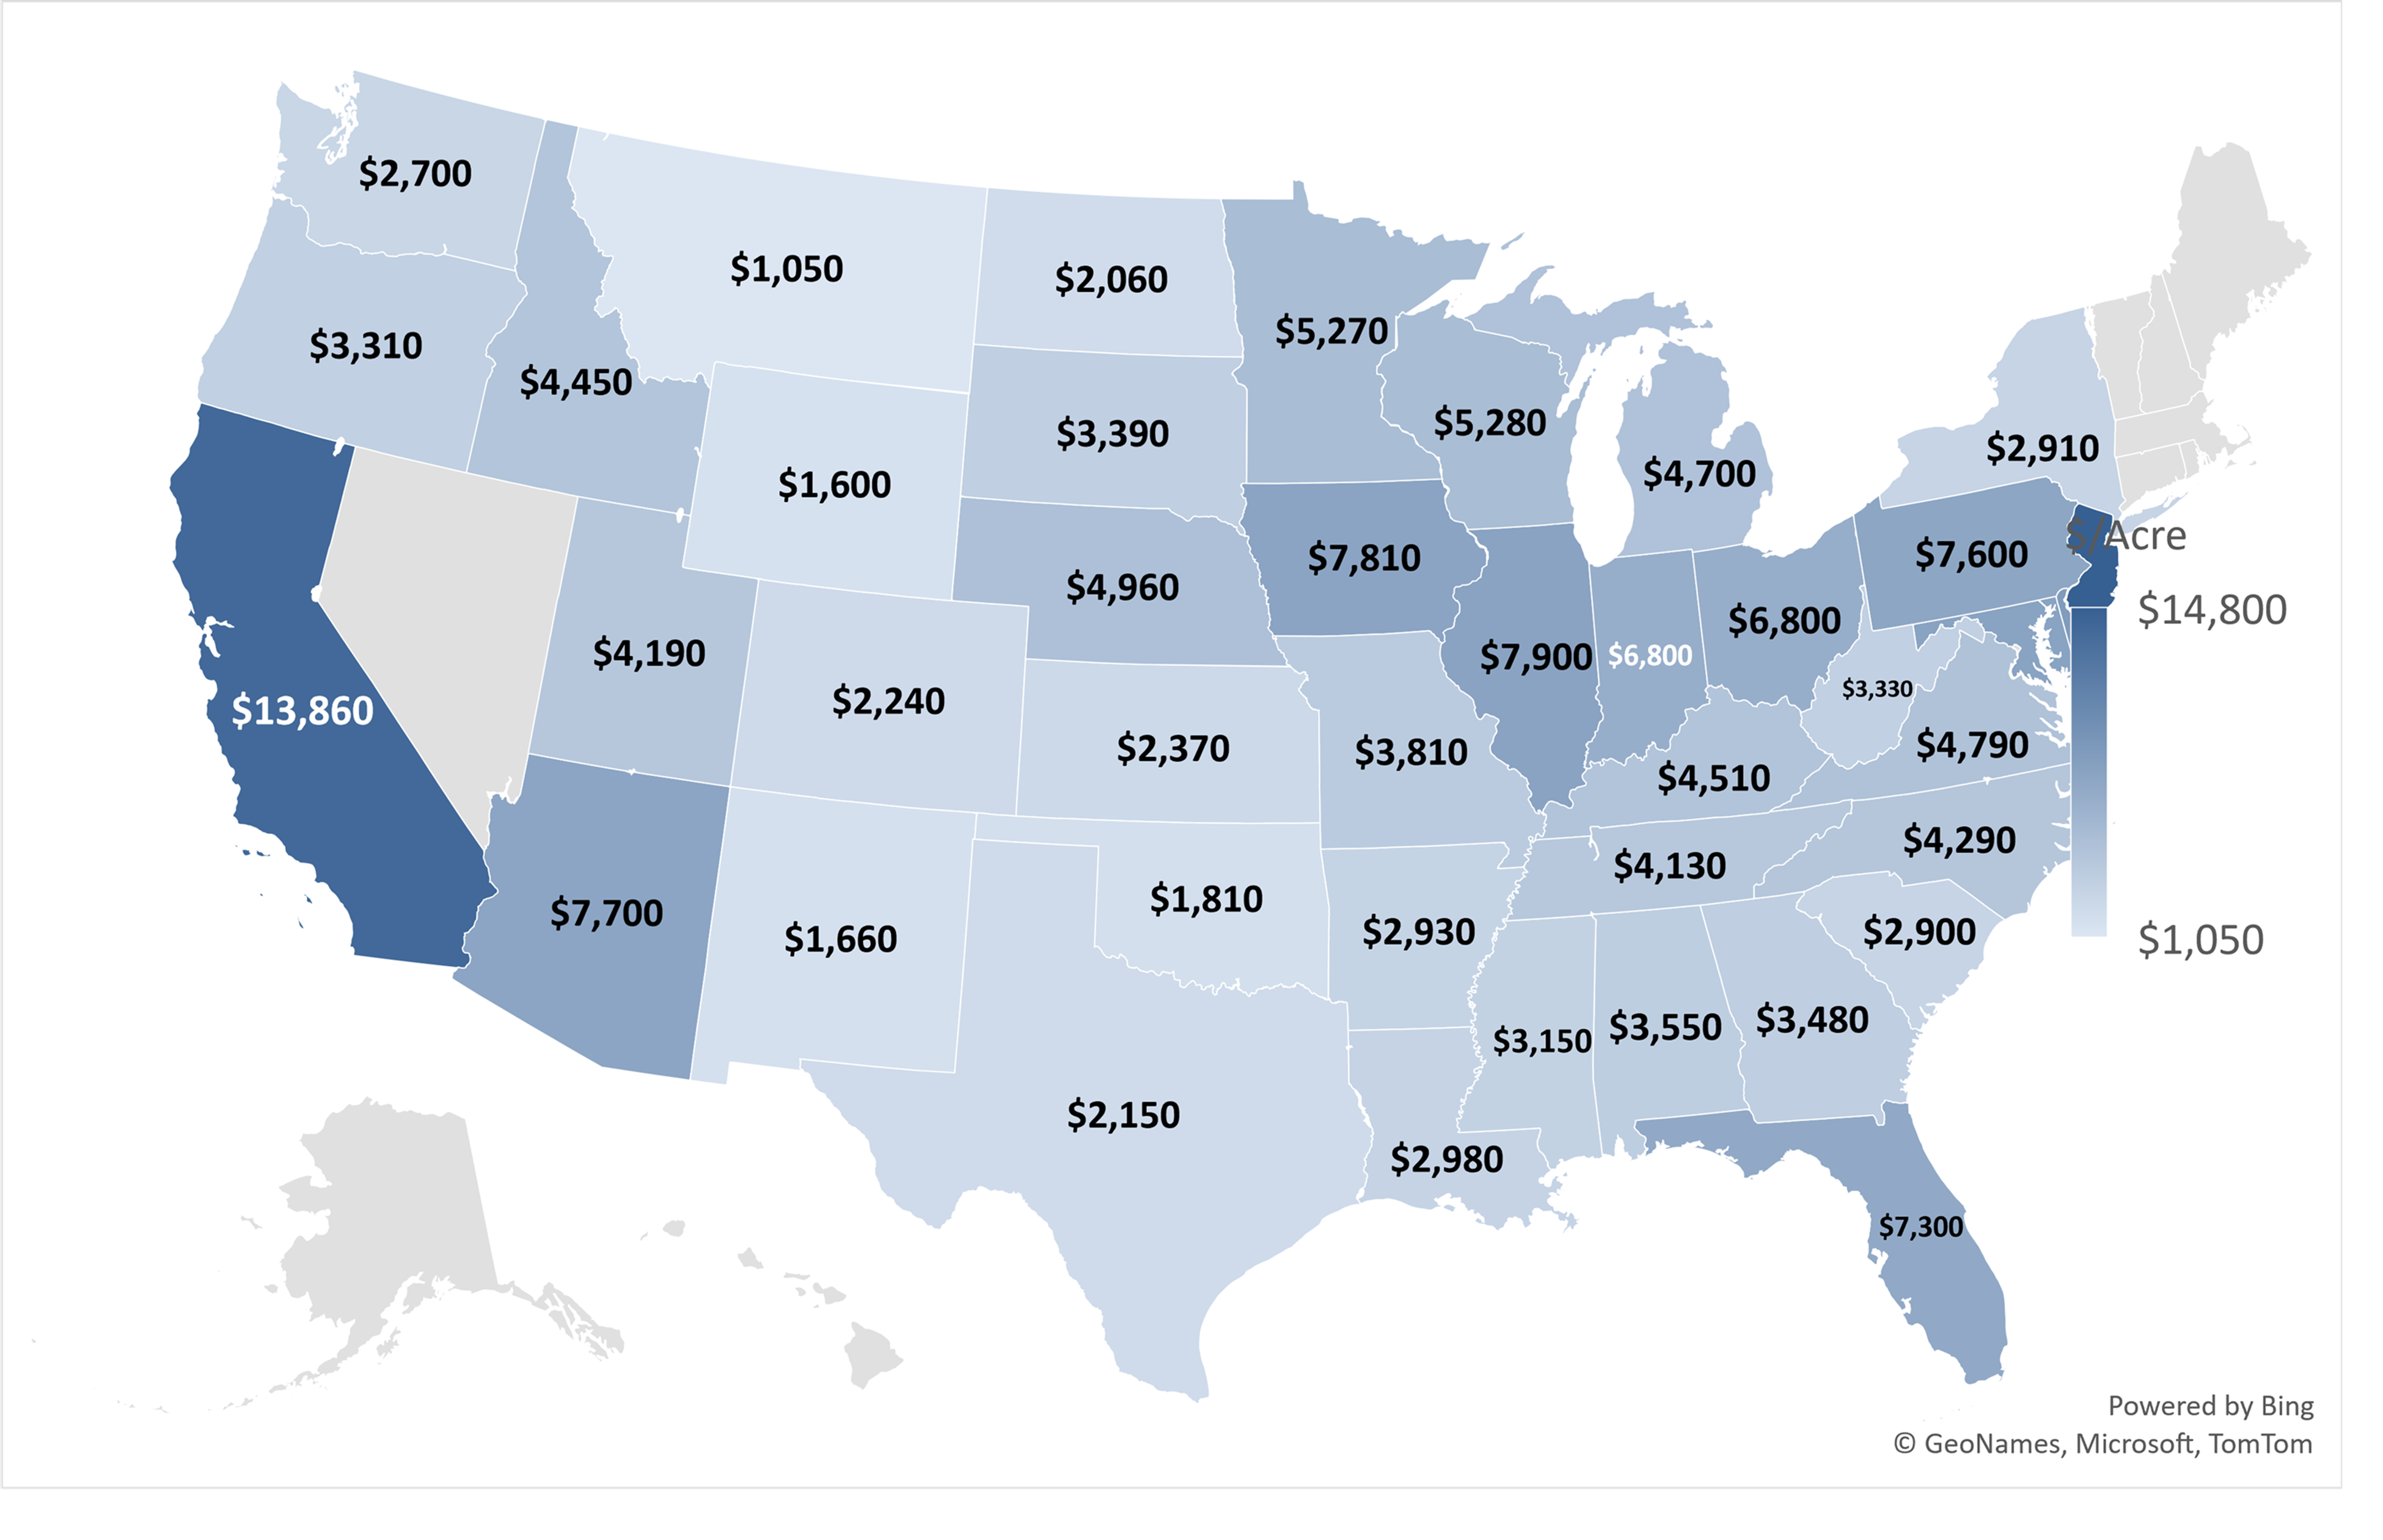
Figure 1. Cropland Values $/Acre 2021 (Source: USDA Land Values 2021 Summary, August 2021)
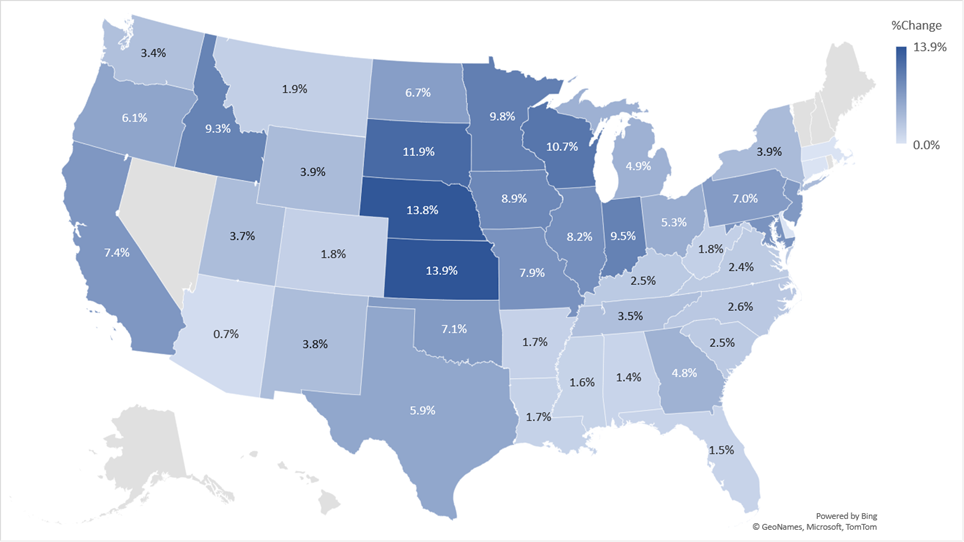
Figure 2. Cropland Percentage Change $/Acre 2020-21 (Source: USDA Land Values 2021 Summary, August 2021)
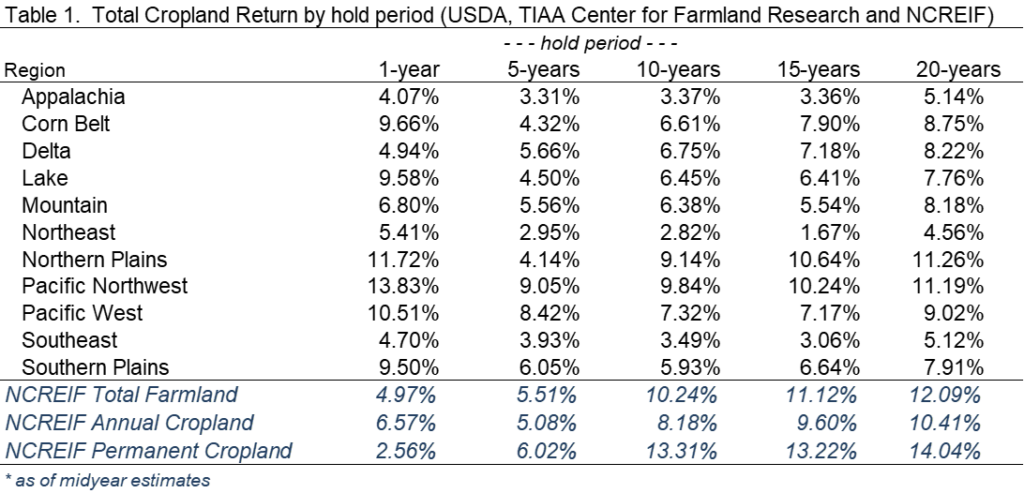
Table 1 below provides additional historic context by aggregating this information into the same production regions used by the National Council of Real Estate Investment Fiduciaries (NCREIF) to group areas with similar production crops and practices and reporting total returns by hold period over selected intervals to 20 years. In addition to regional totals based on USDA data, the lower three rows provide total performance for assets held in the NCRIEF index by type of production.
Where to from Here?
Over the past two years, unprecedented monetary stimulus was injected into the economy within pandemic-related shutdown and support programs. Figure 3 below shows the stark impact on M1 money supply and provides a sense of the scale of the stimulus relative to historic monetary aggregates. At the same time, the Fed’s narrative was originally that this would not be inflationary because it was simply a temporary transfer to offset lost wage/production values and would dissipate without permanence. Major disruptions took place in supply chains and labor markets, and considerable shifts occurred in consumer food consumption habits also occurred, but with nearly incontrovertible signals of price inflation registering in food, transportation, energy, and housing in particular. In only the past couple of months, the narrative from the Federal Reserve has shifted from “no concern” toward serious concern about excess inflation and about controlling levels of growth in the future.
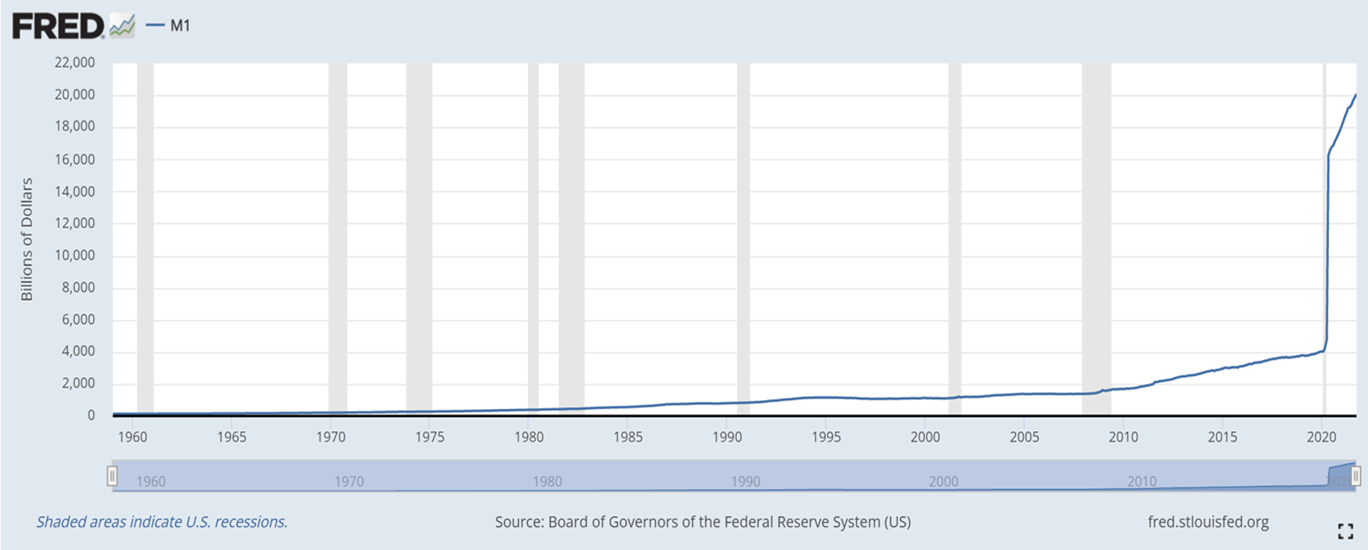
Figure 3. M1 Monetary Aggregate (currency and short term liquid assets. Source- FRED)
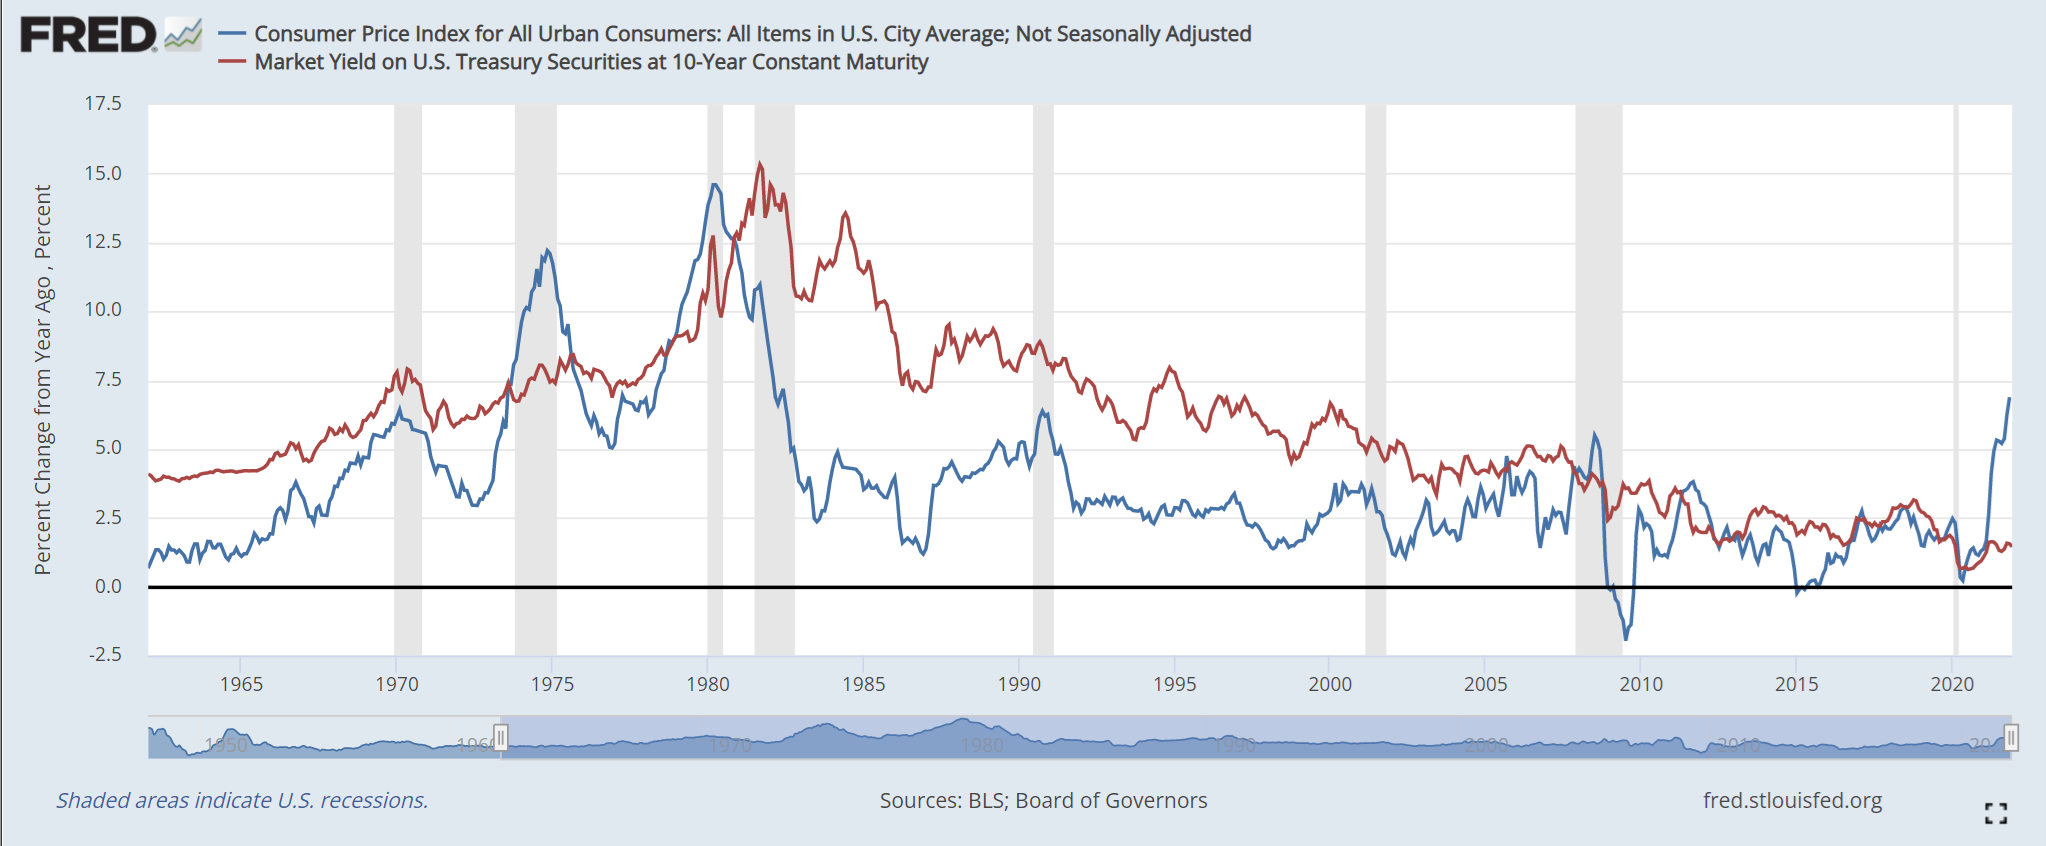
Figure 4. CPI Inflation and Yields on 10-yr Treasury Securities
Figure 4 shows the Bureau of Labor Statistics (BLS) Consumer Price Index (CPI) along with the 10-year Treasury Constant Maturity (CMT-10) interest rate. Periods of recession are shaded in gray bars. A strong historic relationship exists between nominal interest rate movements and inflation with a simple correlation of about 67% from 1965 to present. What is truly remarkable in the graph is the stark departure in the final half year where inflation has climbed rapidly while interest rates remain relatively low and stable. Nearly all economists conclude that inflation is clearly higher and more permanent than reported as Fed targets, and that some form of monetary adjustment will be needed to control “overheating” in the next couple of years. The impact on farmland is yet to be seen, but there are lessons from the past that at least may be instructive in forming expectations for future effects.
To better judge the forward impacts of these issues, it is helpful to consider the historic relationship between inflation and farmland returns. Farmland is an immense asset class totaling over $3 trillion in the US alone, but it is also one that has limited directly observable data on long-term returns at the level of the individual farm. In the analysis below, the asset class as a whole is considered through the use of a set of returns data at the state level and in various agricultural regions throughout the US from 1969 to present based on USDA data and maintained at the TIAA Center for Farmland Research at the University of Illinois. In simplest form, annual rates of returns are constructed as rental income plus appreciation less property taxes, divided by initial value. All series presented are converted to geometric annual returns for consistency. An aggregated index of the top 32 agricultural producing states is used as a proxy for the agricultural farmland market to compare to the CPI and Treasury yields.
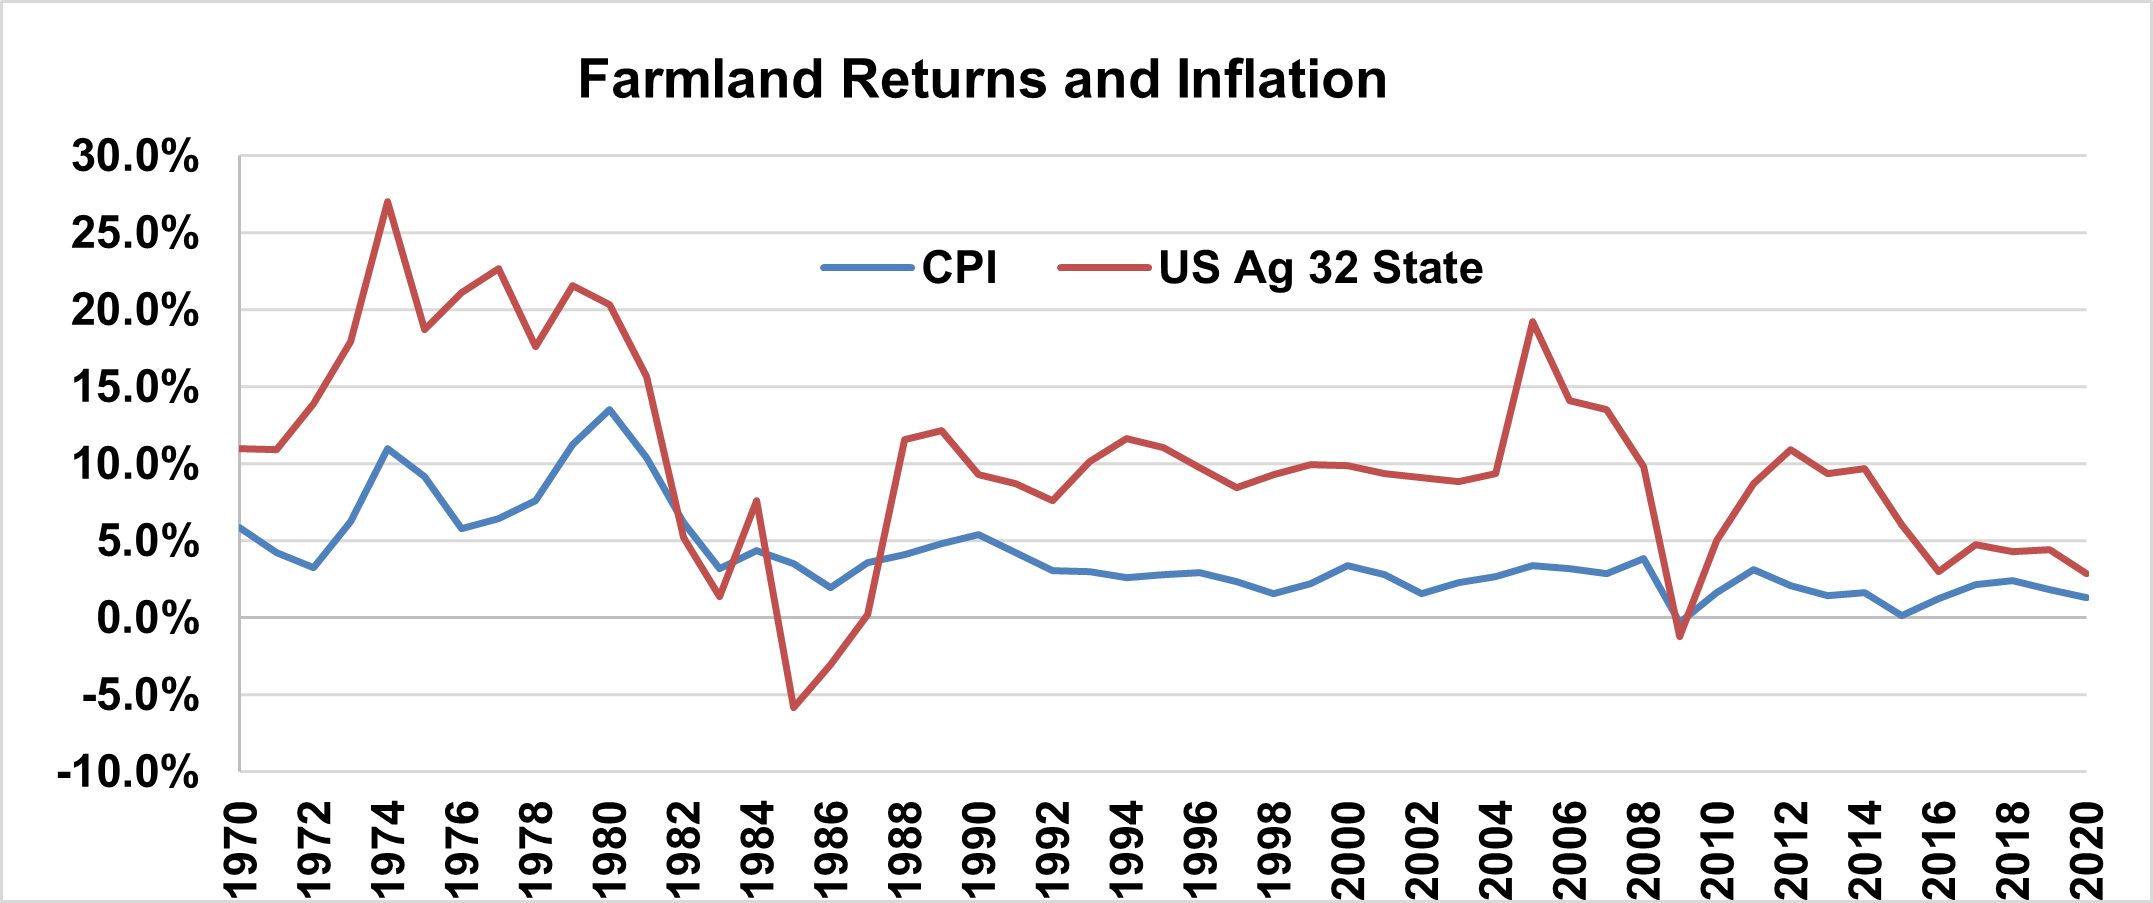
Figure 5. Farmland Aggregate Returns and Inflation 1970 to Present. (Sources: Bureau of Labor Statistics and TIAA Center for Farmland Research)
Some interesting features are evident in the graph over long time period with differing monetary regimes and inflation rates. During the 1970s after the US went off the gold standard, inflation was largely unchecked. Inflation rates hit double digits, peaking at the start of the 1980s. These were also the halcyon days for agriculture, and farmers and lenders began promoting programs that later backfired under a perfect storm for agricultural producers. Multiple foreign crises then culminated in a grain embargo and oil market turmoil while fixed interest rates on farm mortgages peaked at nearly 18%. Inflation peaked at more than 10%, and farmland was caught in a credit-induced crisis. Thereafter, Treasury rates and inflation become more actively managed by the Fed with ensuing targets below 5% for the period that started in the late 1980s and persists through the present. Many argue that the secular inflation and interest rate targets are now sustainably lower than in prior decades, but inflation signals have also rapidly returned.
The question going forward can be posed in two parts: (1) is inflation going to be higher and sustained, and (2) what will be the impact on farmland values. The current evidence for increased and at least near-term inflation appears rather direct, and the long term relationship between farmland returns and inflation is also relatively strong. There are transitional impacts and risks of other macro shocks that can intervene of course, but the long term thesis for farmland returns remains relatively strong.
Summary
While it is more difficult to buy farmland assets than to buy stocks or bonds and the transactional costs are higher, the high and relatively low risk returns, and tax advantages associated with real assets help to even out initial acquisition disparities over time. In any case, the interest in farmland as an asset to add to mixed asset portfolios and to existing operations has never been higher. Every parcel of farmland is unique, thanks to a host of factors including crop type, soils, and regional issues as well external factors such as terminal locations for products. Fortunately, the farmland market is becoming more accessible and more understandable due to advances in ag-tech, improvements in informational sources, and the development of sophisticated and efficient financial channels as well – in short, the financialization of the asset class appears to be in full swing. The traditional factors impacting farmland values remain in play, and increasingly, issues such as water rights, production practices, and payments for environmental attributes are becoming important as well. Finally, while it is impossible to predict the future performance based on history alone, expected population growth and increased standards of living which lead to higher quality diets will help agriculture to remain a critical sector forever – leading many to ask “what asset would you rather own?”
Additional Resources
The recorded presentation and complete set of slides for this segment can be found at: https://farmdocdaily.illinois.edu/webinar/farmland-values-and-rental-rates-for-2022
Disclaimer: We request all readers, electronic media and others follow our citation guidelines when re-posting articles from farmdoc daily. Guidelines are available here. The farmdoc daily website falls under University of Illinois copyright and intellectual property rights. For a detailed statement, please see the University of Illinois Copyright Information and Policies here.