Net Change in CRP Acres, 2020-2021 Program Year
Net change in CRP (Conservation Reserve Program) acres is examined for the CRP program year that began October 1, 2020. Net change is a key CRP metric in years that new acres can be signed up. Both General CRP and Grassland CRP had new acre sign ups (the October 25, 2021 farmdoc daily contains results of these sign-ups). On the other hand, even though program incentives were enhanced, expiring CRP acres may not be reenrolled, especially if commodity prices are high as in 2021. In net, by the end of the 2020-2021 program year, General CRP had fewer acres while Grassland CRP had more acres. Implications are discussed.
All CRP acres, October 31, 2021
CRP acres total 22.3 million (see Figure 1) (USDA, FSA (US Department of Agriculture, Farm Service Agency), 2021, October). Sub-program shares are General CRP (46%), Continuous CRP (36%), and Grassland CRP (18%). General CRP retires cropland from production for most commonly 10 to 15 years. Its focus is whole fields and farms. Continuous CRP has the same land eligibility requirements as General CRP, but targets the most environmentally beneficial land within fields. Grassland CRP emphasizes support for grazing operations, plant and animal biodiversity, and eligible land containing shrubs and forbs under the greatest threat of conversion. A permanent cover is maintained. Grassland CRP acres do not have to be previously cropped. For further discussion of the sub-programs, see the appendix in the October 25, 2021 farmdoc daily article.

Net Year-over-Year Change
In net, total CRP acres increased 1.5 million during the 2020-2021 program year (see Figure 2). Acres also shifted among the sub-programs. Grassland CRP acres more than doubled, General CRP acres declined 10%, and Continuous CRP acres increased 5%. Continuous CRP is always open for new enrollment.

Net Change in Total CRP Acres by State
In net, total CRP acres increased in 17 states and declined in 28 states. Net acres increased by at least 100,000 in 6 states, led by 546,665 acres in Colorado (see Figure 3). Largest net decline was -42,376 acres in Idaho.

Net Change in General CRP Acres by State
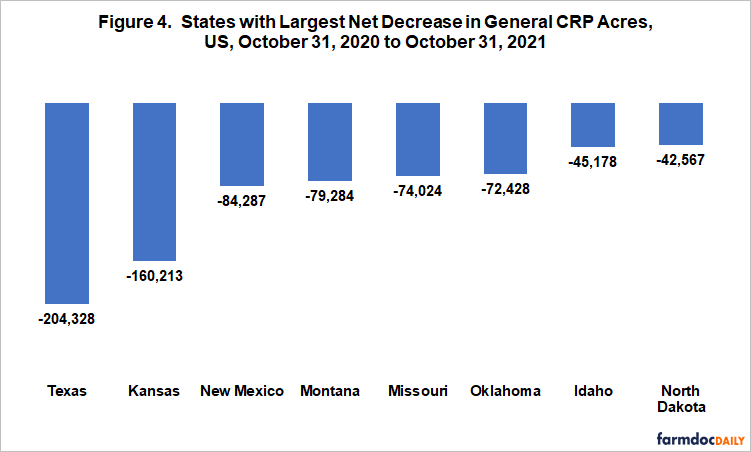
In net, General CRP acres declined for 40 states, with net decline largest in Texas and Kansas (see Figure 4). The 8 states listed in Figure 4 accounted for 70% of the net decline in US General CRP acres. Only 3 states had a net increase in General CRP acres: Utah (+6,763), Wyoming (+4,791), and Alaska (+2,462) .

Net Change in Grassland CRP by State
In net, Grassland CRP acres increased in 33 states and declined in 5 states. The 9 states in Figure 5 accounted for 95% of the US net increase. Net increase was largest in Colorado. Net decline was largest in North Carolina, but it was only a -185 acres.

Summary Observations
Even with enhanced program incentives, the 10% net decline in General CRP acres underscores the important role crop prices play in determining General CRP acres.
In contrast, despite high crop prices, acres in Continuous CRP increased a net 5%.
The net decline in General CRP acres reduces CRP’s land retirement role, likely expanding agricultural output. Negative environmental impacts can be minimized if the most environmentally sensitive part of these fields are shifted to Continuous CRP. It would thus be useful to know what share of acres removed from General CRP were shifted to Continuous CRP.
Given the attention to carbon sequestration, both in general and in the 2021 sign ups, it would be useful if USDA explicitly identified what practices sequester carbon and provided quantitative estimates of carbon sequestered by CRP in total and by each of the sub-programs at the end of each CRP reporting year. This information would be particularly useful for the general public audience.
The policy value of an annual carbon sequestration report for CRP would be bolstered by a well-funded and appropriately designed research program to monitor carbon changes in CRP land, thus helping to improve our understanding of the interface between carbon sequestration and farming and environmental practices.
Data Sources and References
US Department of Agriculture, Farm Service Agency. 2020, October. Conservation Reserve Program Statistics: Conservation Reserve Program: Monthly Summary October 2020. https://www.fsa.usda.gov/programs-and-services/conservation-programs/reports-and-statistics/conservation-reserve-program-statistics/index
US Department of Agriculture, Farm Service Agency. 2021, October. Conservation Reserve Program Statistics: Conservation Reserve Program: Monthly Summary – October 2021. https://www.fsa.usda.gov/programs-and-services/conservation-programs/reports-and-statistics/conservation-reserve-program-statistics/index
Zulauf, C., K. Swanson, G. Schnitkey and N. Paulson. “2021 CRP (Conservation Reserve Program) Sign Up Dashboard.” farmdoc daily (11):146, Department of Agricultural and Consumer Economics, University of Illinois at Urbana-Champaign, October 25, 2021.
Disclaimer: We request all readers, electronic media and others follow our citation guidelines when re-posting articles from farmdoc daily. Guidelines are available here. The farmdoc daily website falls under University of Illinois copyright and intellectual property rights. For a detailed statement, please see the University of Illinois Copyright Information and Policies here.


