Grain Farm Income Projections for 2022 and 2023
Grain farm incomes have been above average in 2020 and 2021 and are projected to remain above average in 2022. For 2023, projections are for lower incomes because of higher costs and projected lower grain prices. Much uncertainty exists about 2023. Farmers have built equipment and financial reserves to withstand low incomes that will inevitably happen sometime in the future.
Grain Farm Income History
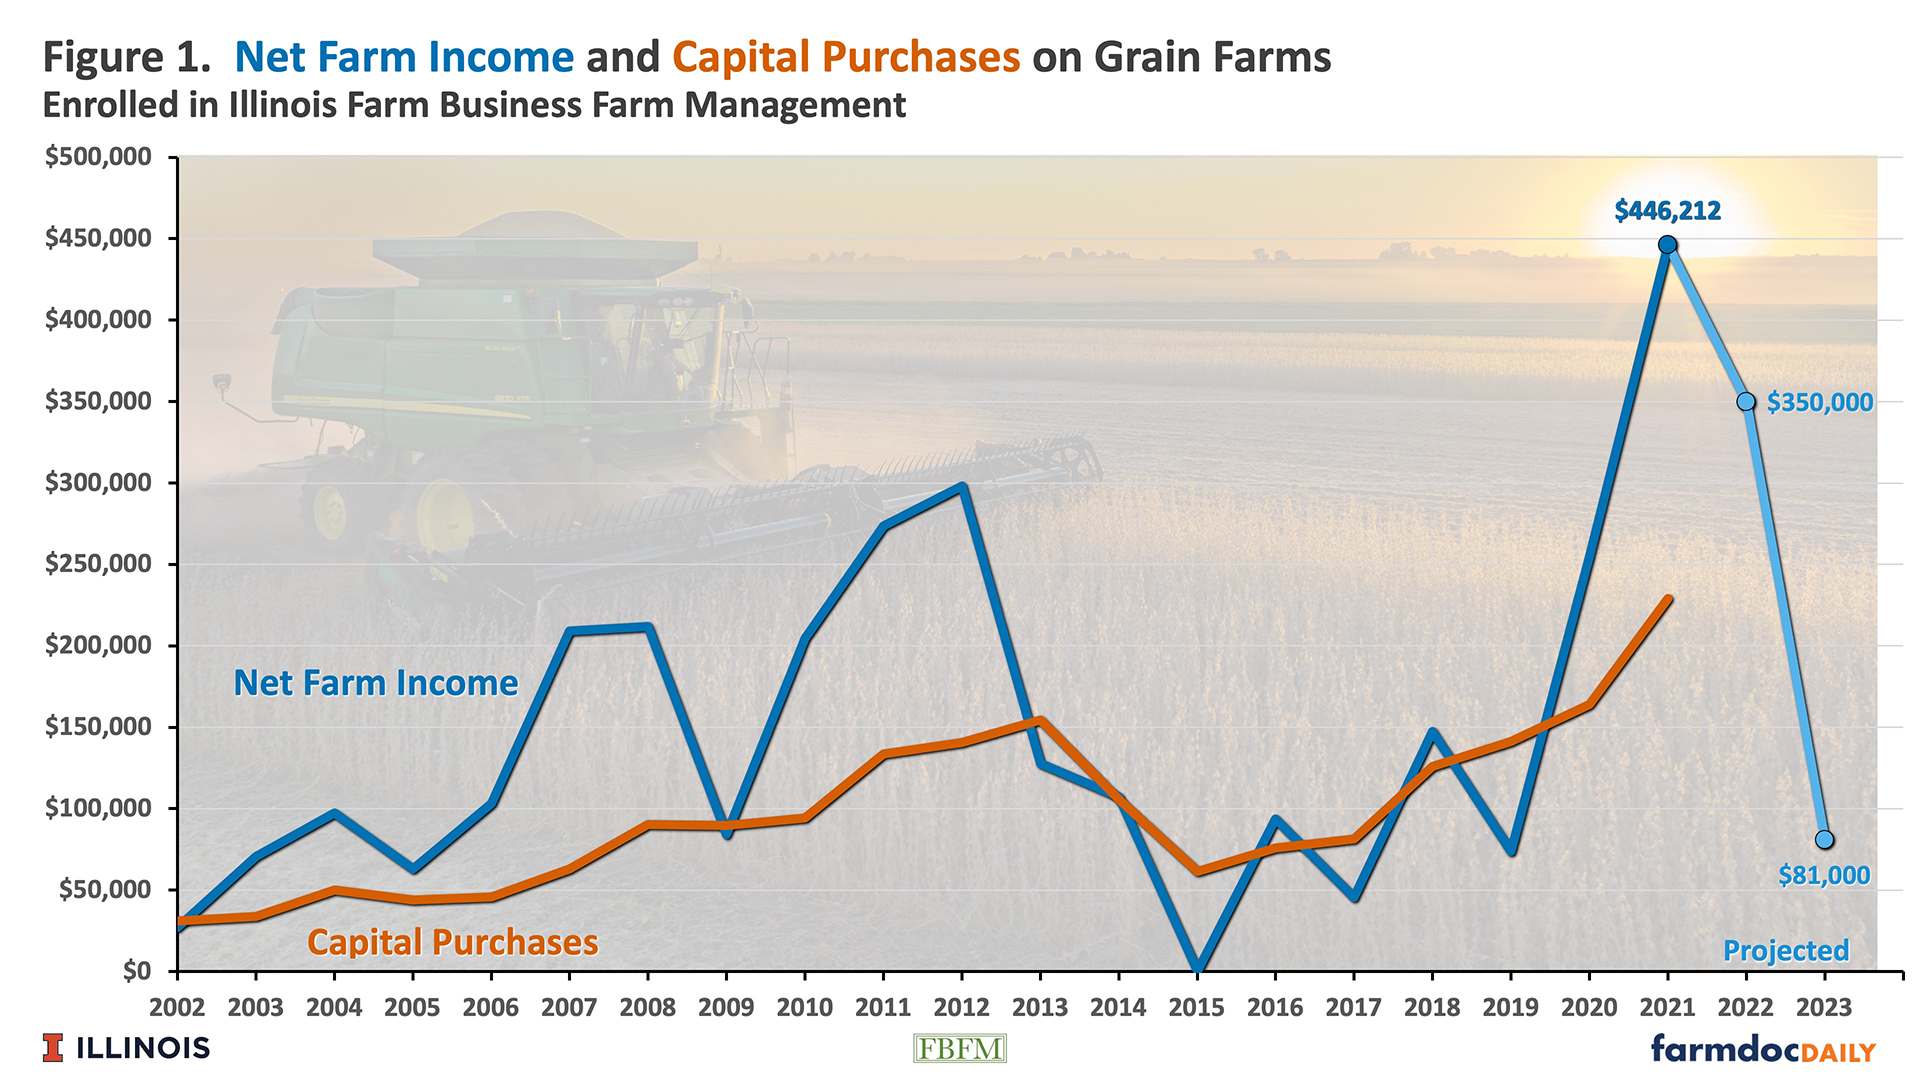
Figure 1 shows the average net income on Illinois grain farms enrolled in Illinois Farm Business Farm Management (FBFM), a cooperative education and farm record-keeping service operated in Illinois. Each year’s income is the average of those farms whose income comes predominately from grain operations. Average farm size and tenure have changed over time as farms have grown. In 2020, the average farm size was 1,300 tillable acres, with 23% of the farmland owned.
Net farm incomes were at high levels in 2020 and 2021. In 2020, the average farm income was $225,000 per farm, the third highest average income, only exceeded by $274,000 in 2011 and $298,000 in 2012. Net farm income in 2021 was $446,000, a record level. Higher 2020 and 2021 incomes stood in contrast to average incomes from 2014 to 2019, when net incomes averaged $78,000 per farm.
Grain farm income in 2021 was high primarily because of above-trend yields and historically high grain prices. In 2021, Illinois farmers averaged $5.90 per bushel for corn and $13.40 for soybeans. Both 2021 corn and soybean prices were well above averages from 2014 to 2020: $3.65 for corn and $9.64 for soybeans. In addition, government payments were small in 2021. Costs had begun to rise, but many farmers had yet to experience a significant increase in fertilizer and other expenses in 2021.
Grain Farm Projections for 2022 and 2023
The projected 2022 average income is $350,000 per farm, $96,000 lower than the 2021 level. Prices used in 2022 projections are $6.40 for corn and $14.00 for soybeans. Those 2022 prices are well above the 2021 actual prices:
- The $6.40 corn price for 2022 is $.50 higher than the $5.90 price for 2021 and
- The $14.00 soybean price is $.60 higher than the $13.40 price for 2021.
Higher commodity prices were more than offset by cost increases. From 2021 to 2022, non-land costs have increased by over $120 per acre for corn and $100 per acre for soybeans (see Figure 1 of farmdoc daily, August 2, 2022).
For 2023, incomes are projected at $81,000 per farm, a projection close to the 2014-2019 average of $78,000 per farm. Yields in 2023 are trend estimates. Costs are projected to continue to increase. Prices used in projections are $5.50 per bushel for corn and $13.00 per bushel for soybeans, still high by historical standards, but lower than 2022 prices. Given the higher cost structure, prices above $5.00 per bushel for corn and $12.00 for soybeans are now needed to break even (farmdoc daily, December 21, 2021).
Financial Position of Farms
Farmers have generally made capital investments on their farms during this period of higher incomes. Average capital purchases on grain farms were $164,000 in 2020 and $229,000 in 2021. The 2020 value was a record level, and the 2021 value eclipsed this 2020 record level (see Figure 1). Farmers typically make larger capital purchases during years of higher income and then reduce purchases during years of lower income. For example, capital purchases were lower from 2014 to 2017, a period of lower income than from 2011 to 2013, a period of much higher income (see Figure 1). When incomes inevitably fall, many farmers have built equipment reserves and will be able to lower their capital purchases.
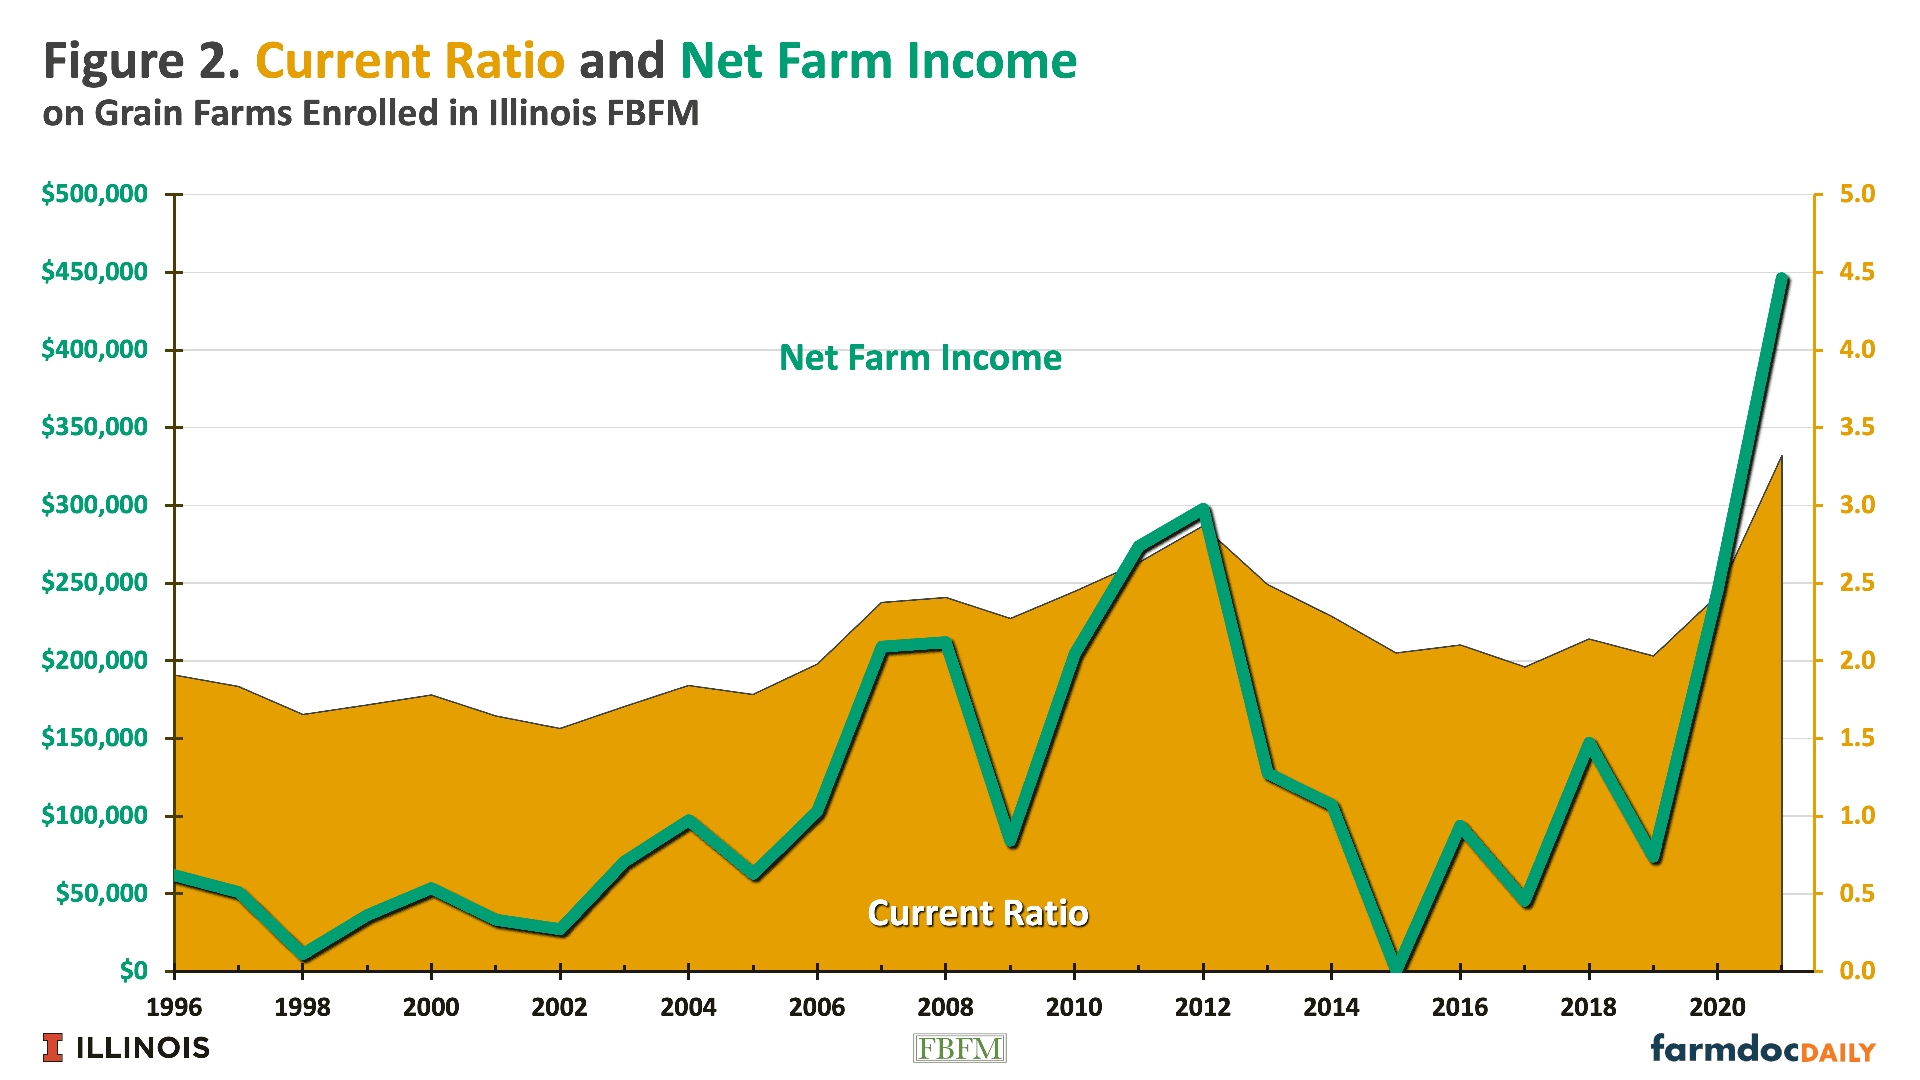
Farmers have also built their working capital, as indicated by the current ratio. The current ratio equals current assets divided by current liabilities, with higher values indicating more current assets relative to current liabilities. In 2021, the current ratio was 3.32, the highest level since 2000 (see Figure 2). The 2021 ratio exceeded the previous high of 2.83, set after the high-income year in 2012.
Current assets are primarily composed of cash and marketable securities, prepaid expenses, and grain inventories, with grain inventories valued using market prices at year end. Potential future declines in grain prices will necessarily reduce current assets and the current ratio. Even given this factor, farmers are in a strong current position.
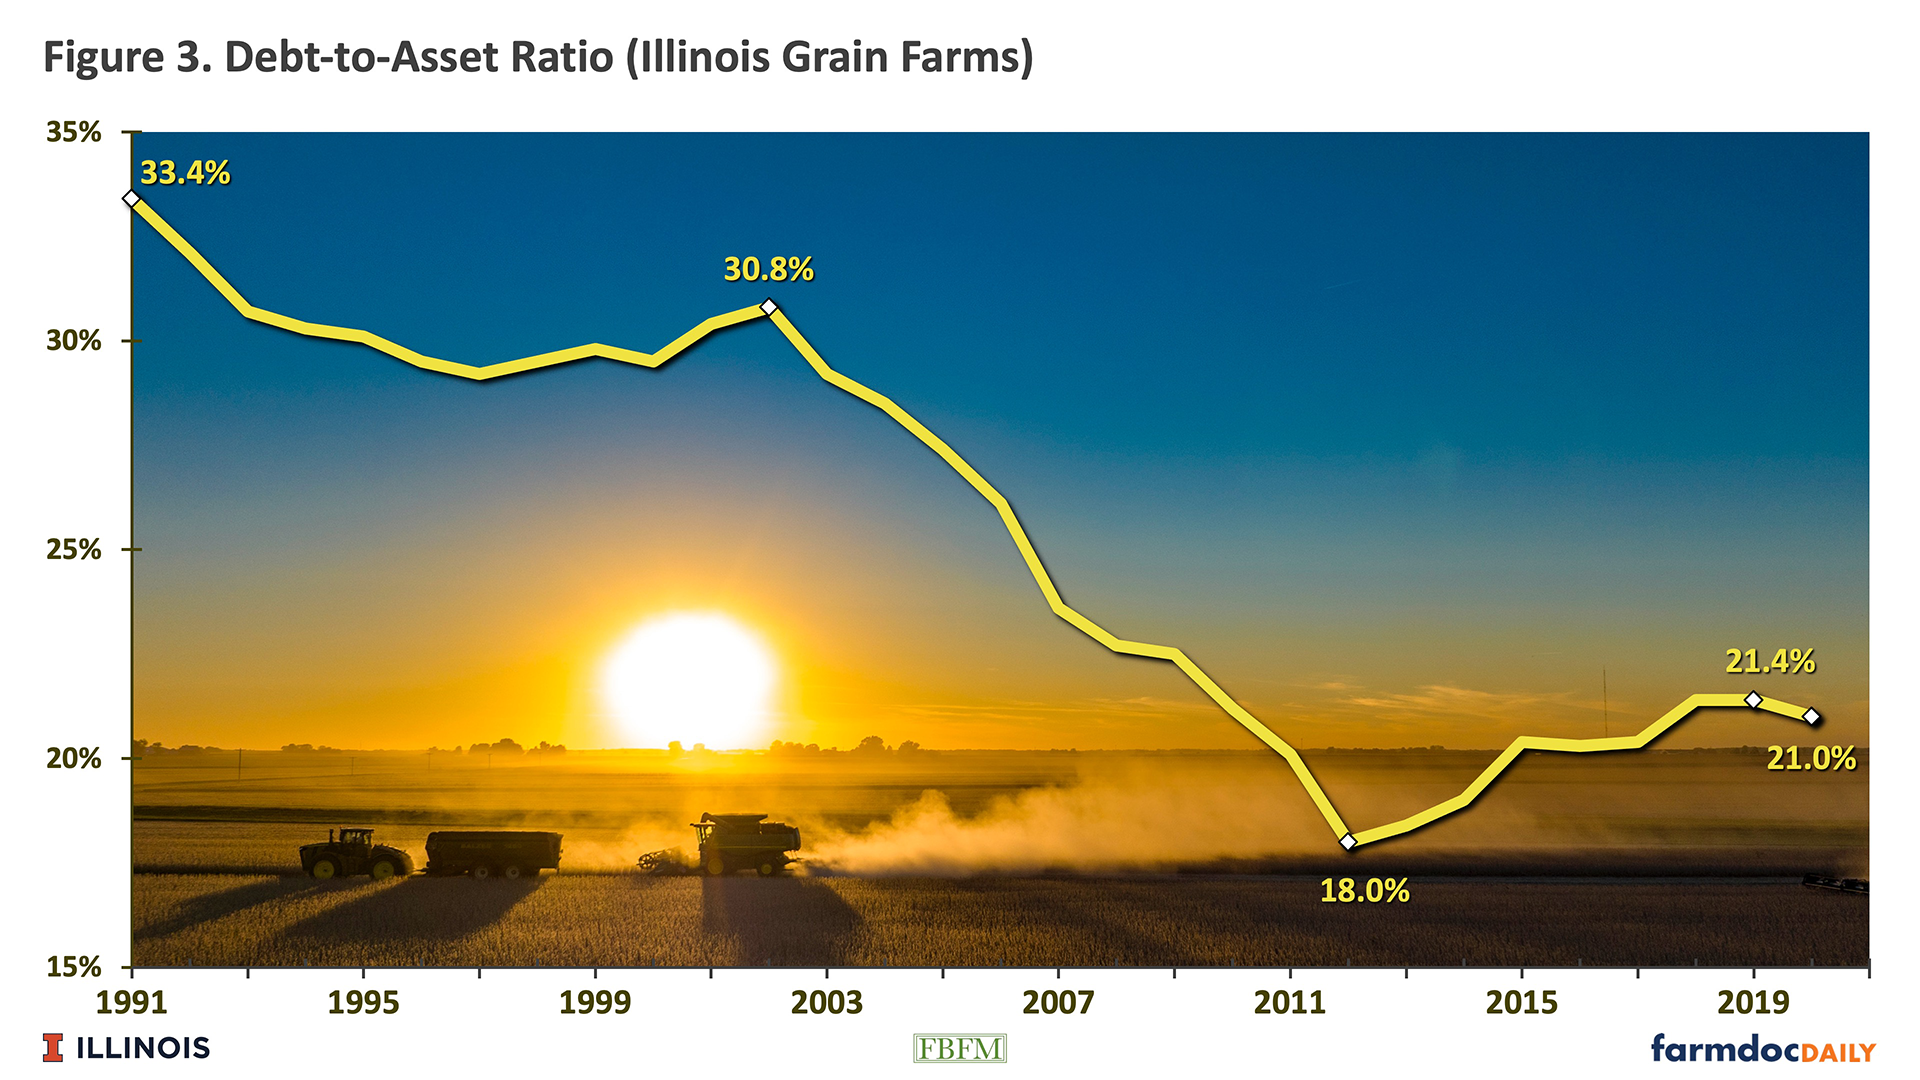
Debt relative to assets also has decreased in recent years. The debt-to-asset ratio was 21% in 2021, a relatively low level. Debt-to-asset ratios averaged 18% in 2012 (see Figure 3).
Overall, debt-to-asset ratios have been at relatively low levels in recent years, with increasing asset values playing a significant role in the low debt-to-asset ratio. Debt levels per acre have increased over time and will likely increase again in 2023, as the high levels of the cost will necessitate larger operating loans on many farms. Still, debt-to-asset positions are relatively strong.
The above shows averages across all Illinois grain farms. Some farms will have fewer financial reserves. For example, younger farmers typically have higher debt-to-asset ratios and lower current ratios than an older cohort. Moving forward, farmers with more debt may face additional adversity as interest rates have risen.
Summary
Grain farm incomes have been above the historical average in 2020 and 2021, and projections indicate another above-average income year in 2022. Those incomes have occurred because of relatively high commodity prices. In addition, farmers have used this period of higher incomes to build equipment and financial reserves.
Projections are for a return to lower incomes in 2023. Obviously, much remains to be seen before 2023 incomes are realized. Higher incomes are possible with a combination of higher yields and continued 2022 levels of prices. However, current fall bids for 2023 indicate lower prices, likely built on an expectation of relatively good yields in South and North America. As is always the case, much uncertainty exists for incomes a year in advance.
However, it is reasonable to expect grain farm incomes to return to a lower level in the future, as always happens in agriculture. Higher costs will lead to lower incomes even at historically high corn and soybean prices. Prices below $5.00 per bushel for corn and $12.00 for soybeans will result in low incomes if not accompanied by higher yields or declines in costs.
Still, farmers are in excellent financial positions and will continue to build their financial positions in 2022. Farmers are preparing for lower incomes that inevitably occur in agriculture.
References
Schnitkey, G., K. Swanson, C. Zulauf and J. Baltz. "2023 Crop Budgets: Higher Costs and Lower Returns." farmdoc daily (12):113, Department of Agricultural and Consumer Economics, University of Illinois at Urbana-Champaign, August 2, 2022.
Schnitkey, G., C. Zulauf, N. Paulson and K. Swanson. "2022 Break-Even Prices for Corn and Soybeans." farmdoc daily (11):168, Department of Agricultural and Consumer Economics, University of Illinois at Urbana-Champaign, December 21, 2021.
Disclaimer: We request all readers, electronic media and others follow our citation guidelines when re-posting articles from farmdoc daily. Guidelines are available here. The farmdoc daily website falls under University of Illinois copyright and intellectual property rights. For a detailed statement, please see the University of Illinois Copyright Information and Policies here.


