


The World’s Increasing Need for Cropped Land
Since 2000 an increasing gap has emerged between growth in consumption and yield of world feed grains, oilseeds, and food grains. As a result, harvested land of these crops has increased 0.9% per year. For 2022, 22 million more acres are needed, and the need grows each year. This consumption-yield gap impacts the poor via higher food prices and the climate via land conversion. Nevertheless, production enhancing research has received little attention in recent public policy legislation, implying continuing pressure on food prices and land use.
Data: The data used in this article are from the Production, Supply, and Distribution Online (PSD) database maintained by the US Department of Agriculture, Foreign Agriculture Service. The analysis begins with the 1981/1982 crop year. Several countries and crops were added to PSD during the 1970s. This starting point follows the end of the 1970 period of crop farm prosperity.
World Consumption: World consumption of feed grains, oilseeds, and food grains since 1980 has a 2nd degree polynomial time trend (i.e. linear and squared time variables) (see Figure 1 and Data Note 1). Relative to a linear model, the 2nd degree polynomial is higher with 99% statistical confidence for feed grains and oilseeds and 95% statistical confidence for food grains (see Data Note 2). Lowest explanatory power is 98% for food grains (100% is a perfect fit). For all three crop groups, trend consumption measured in quantity has grown each year, with the increase becoming larger over time.

World Yield: Since 1980, world yield has a 2nd degree polynomial time trend for feed grains and oilseeds but a linear time trend for food grains (see Figure 2). Lowest explanatory power is 97% for oilseeds. Relative to a linear model, the 2nd degree polynomial is statistically higher with confidence of 99% for feed grains and 95% for oilseeds (see Data Note 3). For feed grains and oilseeds, trend yield measured in metric ton per hectare has increased each year with the increase becoming larger over time.

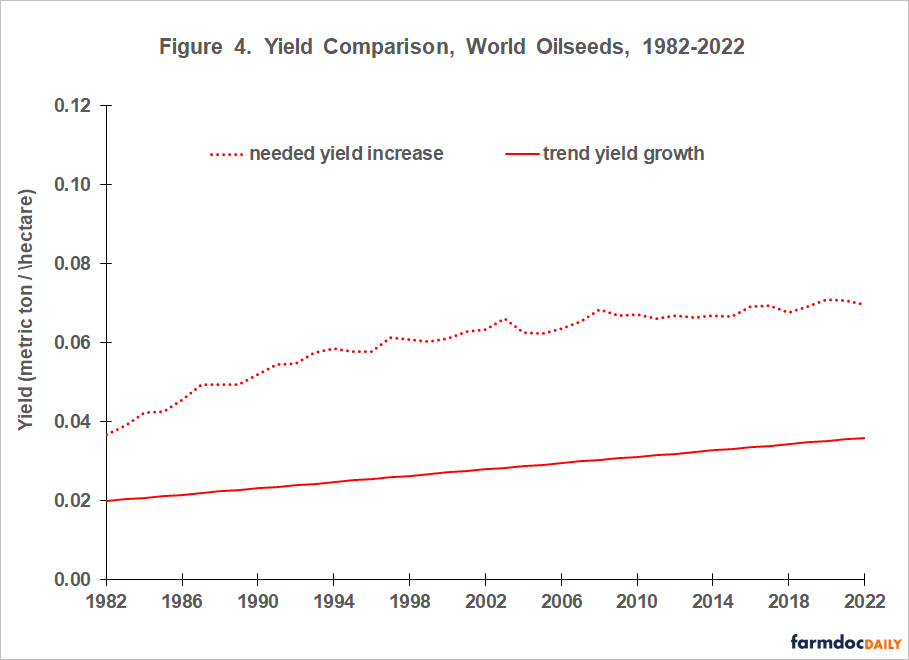
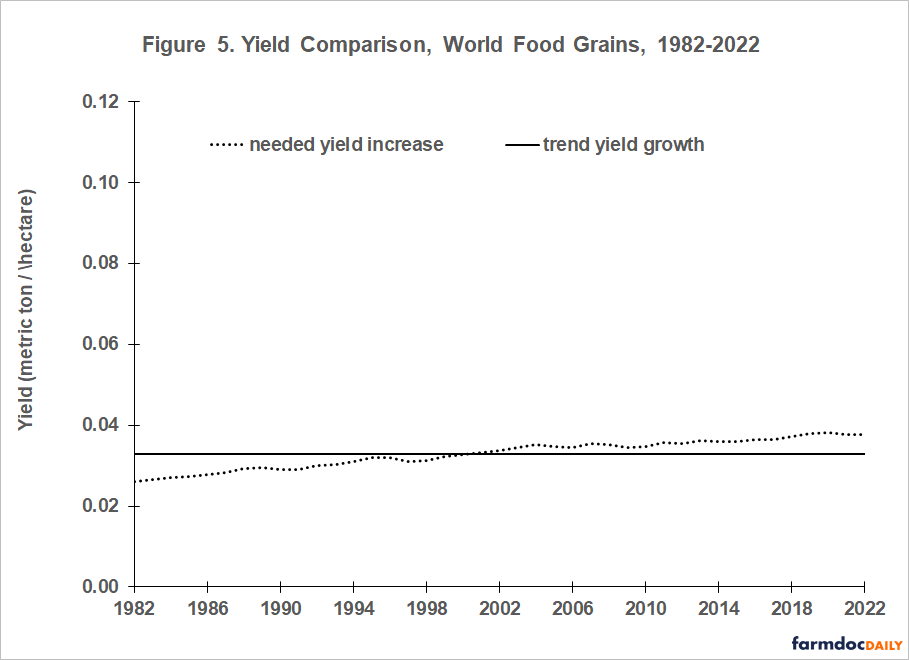
Yield Gap: Historical time path of trend yield derived from the equations in Figure 2 are presented in Figures 3, 4, and 5 for world feed grains, oilseeds, and food grains, respectively. Figures 3-5 also present the increase in yield needed to satisfy the trend increase in consumption derived using the equations in Figure 1 and assuming harvested area is the same as the preceding year (i.e. no increase in harvested area). Data Note 4 contains an example of this calculation.
In 2000, world feed grains transitioned from needing less harvested land to needing more harvested land to satisfy growing consumption (see Figure 3). The yield gap has increased since. For oilseeds, trend yield has always been less than the increase in yield needed to satisfy the growth in trend consumption (see Figure 4). More oilseed land has been needed, but the yield gap has not increased since the late 1990s. For food grains, the two yields have similar paths, but in 2002 food grains transitioned from needing slightly less land to needing slightly more land each year (see Figure 5).

World Harvest Area: The combined land harvested for feed grains, oilseeds, and food grains since 1980 underscores the story in Figures 3-5. Harvested land exhibited no trend before 2002, varying around an average of 835 million hectares. Since 2002, it has increased from 824 million hectares to a projected 986 million hectares for the 2022 crop year. The rate of increase has averaged 0.9% per year, which translates, using 2022 projected harvested land, into a need for nearly 9 million more hectares or 22 million more acres of feed grains, oilseeds, and food grains per year. This additional land is equivalent to adding the principal crop acres farmed in Illinois each year.

Summary
Since 2000, an increasing gap has emerged between growth in consumption and yield of world feed grains, oilseeds, and food grains. This gap is projected to continue over the next 10 years (see, for example, the projections by the Organisation for Economic Cooperation and Development – Food and Agriculture Organization, June 29, 2022).
Potential responses to this consumption-yield gap are:
- More harvested land: Harvested feed grain, oilseed, and food grain land has increased 0.9% per year since 2002, translating into a current need for 22 million more acres per year. Sources of new harvested land are land conversions, which potentially negatively impacts climate, and growing multiple crops on current cropland. A major expansion in multiple cropping will require research to tailor seeds and practices for it. See the October 28, 2020 farmdoc daily for a discussion of multiple cropping and US agriculture’s future.
- Higher prices: Higher prices will curb the growth in consumption. The rise in food prices since 2020 may be the first step in this adjustment, an adjustment that will disproportionately impact the poor. Increasing food prices contribute to higher inflation, which impacts interest rates and economic activity (for a discussion of recent US inflation and interest rates, see farmdoc daily October 12, 2022.)
- Increased yield growth. The stable path of yield growth since 1980 does not suggest a yield jump is imminent. Both historical observation and academic research (see Fuglie, 2018, and studies reviewed therein) strongly imply higher yield growth will require more funding for yield enhancing research.
Large land conversion and food price inflation raise issues for global food security and global security in general.
Research to enhance multiple cropping and yield growth has received little to no attention in recent public policy legislation. Of note, climate change legislation in the Inflation Reduction Act of 2022 provided no money for such research. Given the lag that exists between research and impact on production, funding for research needs to be increased sooner rather than later if it is to help address land conversion and food price inflation. The next opportunity for the US to prioritize this research is the upcoming farm bill.
Data Notes
- Feed grains are barley, corn, millet, oats, and sorghum. Food grains are rice, rye, and wheat. Oilseeds are cottonseed, peanuts, rapeseed, soybeans, and sunflowers. Copra and palm kernel are not included because harvested area is not reported, and thus yield cannot be calculated.
- R2 of 2nd degree polynomial and linear (in parenthesis) regressions of world consumption is 99.1% (91.6%) for feed grains, 99.7% (97.1%) for oilseeds, and 98.3% (98.1%) for food grains.
- R2 of 2nd degree polynomial and linear (in parenthesis) regressions of world yield is 97.6% (96.5%) for feed grains, 97.0% (96.5%) for oilseeds, and 97.9% (97.9%) for food grains.
- The example is for 2020 feed grains. Trend consumption was calculated for 2019 and 2020 using the equation in Figure 1: 731.82 – 2.552x + 0.4949x2, where x takes the value 39 for 2019 and 40 for 2020 (number of observations since start of analysis period). The resulting values are 1386 and 1423 million metric tons of feed grain consumption in 2019 and 2020, respectively. The 37 million metric ton increase in trend consumption (1423 – 1386) would require yield to increase by 0.113 metric ton per hectare given that 327 million hectares of feed grains were harvested in 2019 (37 / 327). The increase in trend yield for 2020 is calculated using the first derivative of the feed grain equation in Figure 2: + 0.0322 + 0.0012x, where x is 40. The resulting increase in trend yield is .080, which is 0.033 less than the needed yield increase of 0.113, assuming no new harvested land.
References and Data Sources
Fuglie, K. 2018. R&D Capital, R&D Spillovers, and Productivity Growth in World Agriculture. Applied Economic Perspectives and Policy. 40 (3, November) 421–444.
Organisation for Economic Cooperation and Development – Food and Agriculture Organization. June 29, 2022. OECD-FAO Agricultural Outlook 2022-2031. https://www.oecd.org/publications/oecd-fao-agricultural-outlook-19991142.htm
US Department of Agriculture, Foreign Agriculture Service. 2022, October. Production, Supply, and Distribution Online. https://apps.fas.usda.gov/psdonline/
Zulauf, C. “Update on US Interest Rates and Inflation.” farmdoc daily (12):155, Department of Agricultural and Consumer Economics, University of Illinois at Urbana-Champaign, October 12, 2022.
Zulauf, C., J. Coppess, N. Paulson, G. Schnitkey, K. Swanson and J. Janzen. “Reimagining the Cornerstone of Agricultural Research.” farmdoc daily (10):190, Department of Agricultural and Consumer Economics, University of Illinois at Urbana-Champaign, October 28, 2020.
Disclaimer: We request all readers, electronic media and others follow our citation guidelines when re-posting articles from farmdoc daily. Guidelines are available here. The farmdoc daily website falls under University of Illinois copyright and intellectual property rights. For a detailed statement, please see the University of Illinois Copyright Information and Policies here.