Guacamole is Back: Seasonal Production from South America Lowered Avocado Prices
Note: This article was written by University of Illinois Agricultural and Consumer Economics PhD student Gustavo Nino Chaparro and edited by Joe Janzen. It is one of several excellent articles written by students in Prof. Janzen’s ACE 527 class in advanced agricultural price analysis this fall.
The price of avocados increased dramatically between January 2021 and July 2022. High avocado prices affect consumption of a major ingredient on American restaurant plates. Avocado is the main ingredient in guacamole and other Mexican dishes popular in the US. Beyond Mexican food, avocado has become an important part of other cuisines (Orenstein 2016). These dining trends have increased demand for avocados in the US so that avocado was the fourth most popular fresh fruit in the US in 2021 by weight with per capita consumption of about 8.4 pounds per person (USDA-ERS 2022). The US avocado market is a $15.4 billion dollar business in 2022 and some consumption forecasts expect this number to $26.2 billion by 2028 (GVR 2022), increasing consumption value by 70 percent in only six years. Given the size of the market, fluctuations in avocado prices have significant impact on US food retailers, restaurants, and consumers.
This article focuses on US markets for Hass avocados, the dominant avocado variety in the US, representing 95% of total consumption. Hass avocados have over time become the preferred variety for producers and consumers because of their comparatively high yields, uniform size, and consistency. Their tough skin allows them to better survive the shipping process (Naamani 2007). Even though the Hass avocado market has grown substantially over time and is expected to grow more in the future, US avocado consumption decreased in the last year. Sales declined 12.6% nationally. In some states such as Texas and Louisiana, consumption was 23.4% lower in 2021 compared to the year prior (Board 2022).
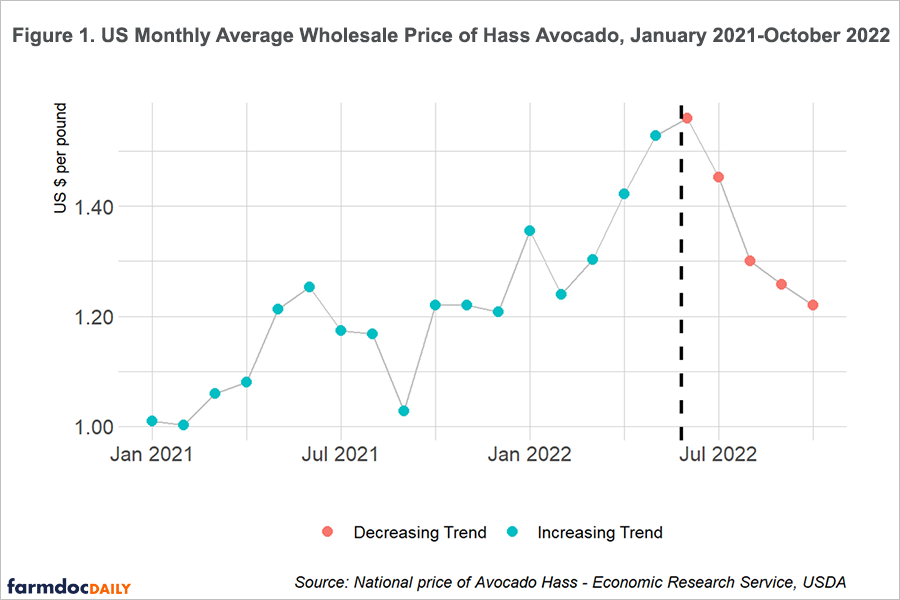
Higher prices are a major part of the story behind the decline in US avocado use. Figure 1 shows the evolution of price in the last two years. Prices rose consistently for 18 months, peaking in June 2022. The cumulative impact of these month-over-month increases was 60% higher prices in June 2022 compared to January of 2021. Since June, price fell by 25%, so that prices are now at levels similar to the beginning of 2021.
Seasonal production shocks are one major reason for the current drop in prices. A larger than normal avocado harvest in Peru during the April to September harvest season replenished avocado supplies. The availability of geographically dispersed seasonal production makes avocado markets more resilient. Just as in other agricultural markets where regional harvest timing differs, high prices may not last as long because new supplies can come to market faster. Similar dynamics are at play, for example, in the world soybean market where South American and US harvests occur earlier and later in the calendar year, respectively. This article sheds light on the impacts of this kind of production seasonality by considering the Hass avocado market.
Who Supplies the US With Avocados?
More than 95% of avocados consumed in the US come from five places: Mexico, Peru, Colombia, Chile and California. Mexico is the main supplier, with market share of about 80% or about 6 billion pounds in the last three years. The second and third source are California and Peru with 11% and 8%. Colombia and Chile have relatively minor shares of the US market representing together about 1% of the market. Note that the top two suppliers are in the northern hemisphere and the last three are in the southern hemisphere.
This geographically dispersed production comes to market at different times and can affect US prices at different times of year. Figure 2 shows typical harvest production window for each supplier. The main window for South American production, especially Peru, starts in April and finishes in September. Total supplies are roughly even between these two time periods. While North American production can come to market all year, the October to March supplies are almost exclusively North American production. Figure 2 shows that nearly 90% of October-March production comes from Mexico with the rest from California. In the April-September period, Mexico still supplies a significant amount of US avocados (60%), but sources of supply are more diverse. Peru (19%) and California (18%) are relatively more important suppliers at this time of year. These patterns indicate that supply shocks in given locations will impact prices at different times over the year.
What’s Happened to Avocado Production Over Time?
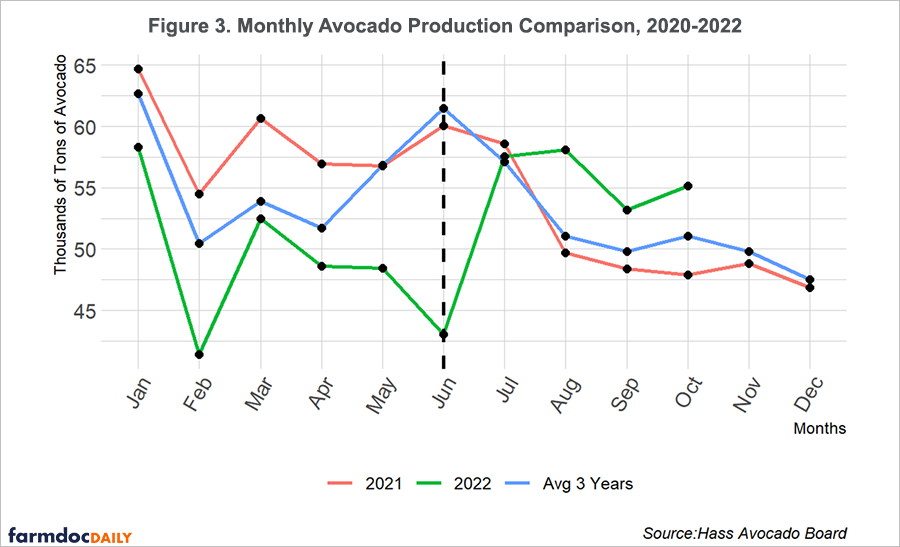
Commodity price changes are frequently caused by supply shocks that affect product availability. Figure 3 depicts the evolution of quantity supplied in the US market by month for each of the past two years, plus the average month supply of the last three years. In 2021, quantity supplied decreased below the 3-year average beginning in June. This shortfall persisted and grew in the first half of 2022. The drop was so big that the difference in quantity supplied between 2022 and 2021 was an average of 10 million pounds per month from January to June.
Figure 3 also shows that the quantity of avocados supplied to the US market rebounded dramatically after June 2022, surpassing the levels of 2021. It appears that this is a common pattern, but in 2022 the under-supply is lower than the average 3-year trend.
Multiple reasons have been given for low availability and high prices in late 2021 and early 2022, centering on the October-March period that is dominated by Mexican supplies. First, persistent supply chain constraints caused by the Covid-19 pandemic may have restricted product flows. Second, drought conditions in Mexico in 2021 may have reduced yields for avocado farmers and lowered total production. Finally, the US government temporarily restricted avocado imports in February 2022 after an inspector received threats from Mexican cartels (Medina 2022). Even though the reasons of under-supply in the first window can be multiple, it appears that the main cause of price reduction in the second window comes from the over-supply of Peru.
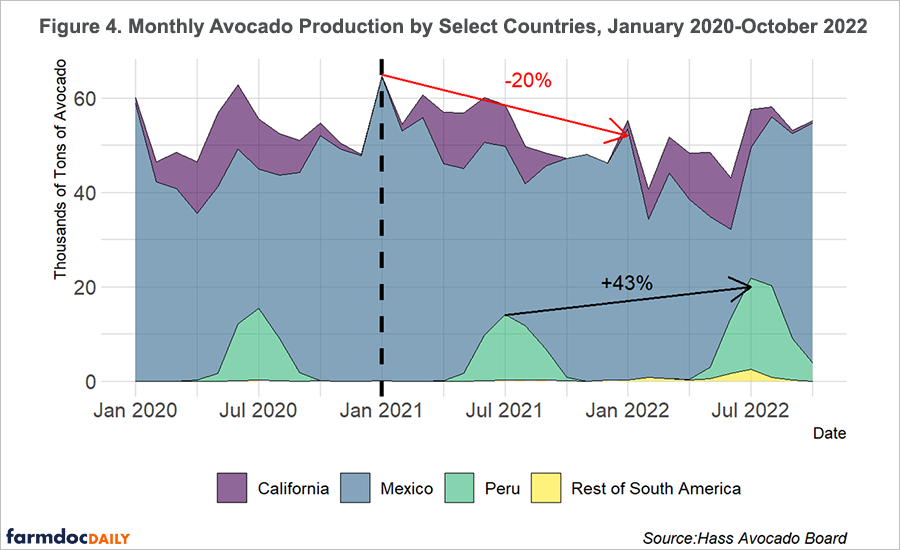
Figure 4 shows monthly avocado production by country since January 2020. In this graph the sum of the levels of each country show the total production. The figure shows that the reduction of production started in August of 2021 and finishes in June of 2022, which coincides with Mexico reduction of production of 20%. On the contrary, seasonal peak production in Peru increased by 43% between July 2021 and July 2022; this coincides with the price decline in the US market shown in Figure 1. These production changes make clear that supply shocks were a major reason for US avocado market price changes in the past two years: the reduction of Mexican supply caused the run-up in prices and the increase in supply from Peru alleviated the shortfall.
How Does the 2022 Price Spike Compare to Past Price Changes?
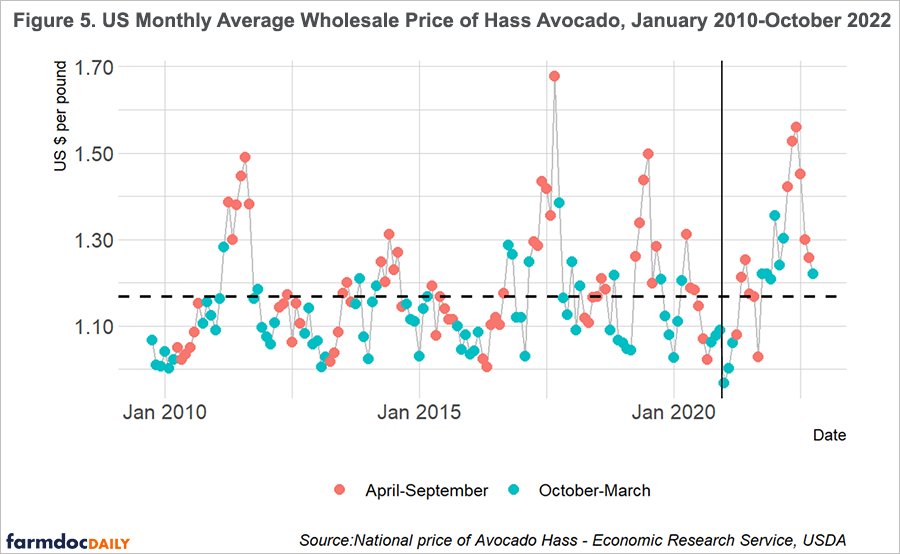
Figure 5 shows the evolution of US avocado prices from January 2010 to October 2022. The figure highlights observations from the two major production windows identified above to identify seasonality in prices. The horizontal dashed line shows the long-run average price over this period to identify periods of high and volatile prices. The figure shows that high prices are more common in the April-September window, as was true in 2022. That said, the 2022 price peak in June was the second highest price observed over the entire time period, suggesting the Mexican avocado shortage affected the price series more than previous years.
The good news is with higher production from Peru, prices have returned to levels close to the long-run average. Differences in harvest timing mean that price spikes are less persistent. Producers cannot profit from high prices for long because global production responds more quickly, an important point for growers of commodities like corn and soybeans where global production is divided between northern and southern hemispheres. For consumers, a quicker path to lower prices provides welcome benefits. Thanks to Peru, we can enjoy guacamole on our plates again.
References
Board, Hass Avocado. 2022. “Avocado Holiday Retail Recap: Easter, Cinco de Mayo, and Memorial Day.” Report Q2 Hass Avocado Board. https://hassavocadoboard.com/research/holidays-events/.
GVR. 2022. “Fresh Avocado Market Size, Share & Trends Analysis Report by Form.” Grand View Research Report:GVR-4-68039-929-5.
Medina, Eduardo. 2022. “U.s. Lifts Temporary Ban on Avocados from Mexico.” The New York Times. https://www.nytimes.com/2022/02/19/business/mexico-avocado-ban-lifted.html/.
Naamani, Gabi. 2007. “Developments in the Avocado World.” California Avocado Society Yearbook 90: 71–76.
Orenstein, Jayne. 2016. “How the Internet Became Ridiculously Obsessed with Avocado Toast.” The Washington Post. https://www.washingtonpost.com/news/wonk/wp/2016/05/06/how-the-internet-became-ridiculously-obsessed-with-avocado-toast/.
USDA Economic Research Service. 2022 “Fruit and Tree Nuts Yearbook Tables.” https://www.ers.usda.gov/data-products/fruit-and-tree-nuts-data/fruit-and-tree-nuts-yearbook-tables/.
Disclaimer: We request all readers, electronic media and others follow our citation guidelines when re-posting articles from farmdoc daily. Guidelines are available here. The farmdoc daily website falls under University of Illinois copyright and intellectual property rights. For a detailed statement, please see the University of Illinois Copyright Information and Policies here.


