


One Year of Perspectives from the Gardner Food and Agricultural Policy Survey
It has been one year since the launch of the Gardner Food and Agricultural Policy Survey, which investigates public perceptions about policies and issues facing food and agriculture today. The four quarterly survey waves were conducted in May 2022, August 2022, November 2022, and February 2023. Some questions are included in each wave, which allows us to track important measures over time, and some questions are added to an individual wave to allow us to quickly learn about public opinion and consumer behavior around unforeseen changes in the food system.
In the last year we’ve discussed important, ongoing issues in agriculture including public perceptions of USDA spending (farmdoc daily, June 24, 2022), concerns about climate change relating to the food system (farmdoc daily, June 10, 2022), public preferences for encouraging sustainable food production (farmdoc daily, September 8, 2022), etc. We also responded to new issues in the food system as they evolved. For example, as food prices began to rise, we measured how consumers felt inflation was affecting their decisions at the grocery store (farmdoc daily, August 25, 2022) and their holiday meal preparations (farmdoc daily, December 7, 2022). Similarly, as shelves of infant formula emptied, we investigated coping mechanisms utilized during shortage (Kalaitzandonakes, Ellison, and Coppess, 2023).
In this post we review survey results from the past year on public perception of the food system and public preferences for agricultural support.
Methods
The Gardner Food and Agricultural Policy Survey is conducted quarterly to measure public perception of agricultural and food issues. The survey is conducted online with approximately 1,000 US consumers each wave. New respondents are recruited each wave to match the US population in terms of gender, age, income, and region.
Tracking Public Perceptions of the Food System
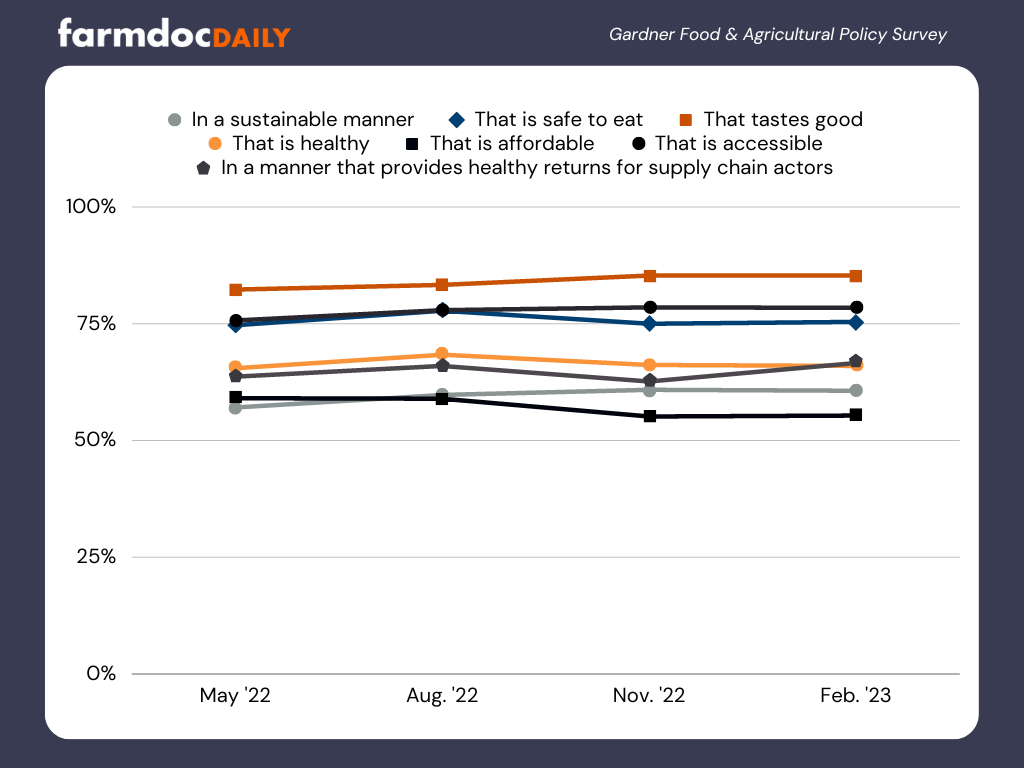
One goal of the Gardner Food and Agricultural Policy Survey is to track public perceptions of the food system. Figure 1 shows the proportion of participants who agree the food system provides food that is sustainable, safe, tasty, healthy, affordable, accessible, and provides healthy returns for supply chain actors (e.g., farmers, manufacturers, grocery stores).
Public perception that the food system produces food that is tasty, safe, and accessible was very high, with more than two-thirds of participants indicating they agreed. Further, over 60% of participants agreed the food system provides healthy returns for supply chain actors. More than half of participants also agreed that the food supply produces food that is sustainable, healthy, and affordable.
Additionally, we find that across the year public perceptions have remained quite stable. For example, as food prices rose, we find only a slight decrease of about 4% in the proportion of consumers who agreed the food system produces affordable food (59.1% in Wave 1, 59.0% in Wave 2, 55.2% in Wave 3, and 55.4% in Wave 4).
Figure 1. Proportion of Participants in Each Survey Wave Who Agree the Food System Produces Food …
In addition, we also monitor trust in important groups along the food system. In particular, we asked participants to what extent they trust restaurants, grocery stores, food manufacturers, farmers, and government on a scale from 1 (meaning they do not trust this group) to 7 (meaning they trust this group very much). Figure 2 shows the results across the four waves. Across the entire year, farmers remain the group with the highest trust, followed by grocery stores, restaurants, food manufacturers, and finally, government.
Figure 2. Participants’ Average Rating of Trust for Groups within the Food System in Each Survey Wave

Tracking Public Perceptions of Agricultural Support
In addition to public perception about the food system, we also track public perceptions and priorities for federal agricultural support. Figure 3 shows the proportion of participants who thought the government should support farmers in each of six potential situations. We find considerable consistency throughout the year, with the public most in favor of financial support for farmers when their crops are harmed by a natural disaster (between 78.1% and 82.8%). Financial support for farmers when crop prices were considered too low received the least support (between 41.4% and 45.9%) across all four waves.
Figure 3. Proportion of Participants in Each Survey Wave Who Think the Government Should Provide Financial Support to Farmers in Each Situation

In addition, we ask participants to indicate which situation they think it would be most important for the government to provide financial support for farmers. As participants can only select one situation, it allows us to better measure the priorities of the public. Figure 4 shows the results across the four waves. Across the year, we find that support for farmers following natural disasters remains the top priority for the public – with around 40% of the participants indicating it was the most important time to provide support for farmers in every wave. Few consumers thought support when crop prices were low or during trade or export restrictions should be the top priority.
Figure 4. Proportion of Participants in Each Wave Who Indicated Each Situation was the Most Important Time for the Government to Provide Financial Support to Farmers

Conclusions
In May 2022 we launched the Gardner Food and Agricultural Policy Survey in part to track public perception of agricultural and food related issues over time. With Congress scheduled to debate and potentially reauthorize a farm bill in 2023, the survey has provided a year of perspectives on a variety of issues that have relevance to that debate. For example, we have tracked public perception of and priorities for government financial support for farmers. In general, survey respondents held relatively stable views about farm policy and consistently indicated that the top priority was for government support to farmers when natural disasters harm their crops. We also found high levels of support for farmers in a variety of situations, including adoption of sustainable production practices and making crop insurance affordable. We find the lowest levels of public support for providing farmers assistance when prices were low.
We also have tracked public perception of the food system and its major participants. Across the year, we find that most participants believe the food system produces food that is tasty, safe, and accessible, and that over half of participants believe the food system produces food in a sustainable manner, that is healthy, and that is affordable. Additionally, we have consistently found high levels of trust in farmers by consumers, providing further backdrop for public support as Congress begins a farm bill effort.
To provide more information for the continuing debate, future posts will review the survey’s most recent findings about public perception of climate change and how to encourage adoption of sustainable farm practices, continuing impacts from inflation, and a deeper dive into public perceptions about farms, including size and income.
References
Kalaitzandonakes, M., B. Ellison and J. Coppess. "Inflation on Holiday Menus: How US Consumers Are Responding to Rising Food Prices This Holiday Season, Gardner Survey Panel 3, Part 2." farmdoc daily (12):184, Department of Agricultural and Consumer Economics, University of Illinois at Urbana-Champaign, December 7, 2022.
Kalaitzandonakes, M., J. Coppess and B. Ellison. "Gardner Food and Agricultural Policy Survey: 2nd Quarter, Impact of Inflation." farmdoc daily (12):128, Department of Agricultural and Consumer Economics, University of Illinois at Urbana-Champaign, August 25, 2022.
Kalaitzandonakes, M., B. Ellison and J. Coppess. "Public Perception of USDA Spending: Gardner Survey Results, Part 4." farmdoc daily (12):94, Department of Agricultural and Consumer Economics, University of Illinois at Urbana-Champaign, June 24, 2022.
Kalaitzandonakes, M., B. Ellison, J. Coppess and P. Bist. "Gardner Food and Agricultural Policy Survey: 2nd Quarter, How to Encourage Sustainable Food Production." farmdoc daily (12):137, Department of Agricultural and Consumer Economics, University of Illinois at Urbana-Champaign, September 8, 2022.
Kalaitzandonakes, M., B. Ellison and J. Coppess. "Climate Change & the Food System: Gardner Survey Results, Part 2." farmdoc daily (12):87, Department of Agricultural and Consumer Economics, University of Illinois at Urbana-Champaign, June 10, 2022.
Kalaitzandonakes, M., B. Ellison, J. Coppess. “Coping with the 2022 infant formula shortage.” Preventative Medicine Reports. 32. April 2023. https://doi.org/10.1016/j.pmedr.2023.102123
Disclaimer: We request all readers, electronic media and others follow our citation guidelines when re-posting articles from farmdoc daily. Guidelines are available here. The farmdoc daily website falls under University of Illinois copyright and intellectual property rights. For a detailed statement, please see the University of Illinois Copyright Information and Policies here.