


Update on Growth Rates of Fertilizer, Pesticide and Seed Costs Over Time
High commodity prices, excellent yields, and large ad hoc government programs have contributed to higher farm income levels for the 2020 to 2022 crop years. However, production costs have also increased substantially leading to potential concerns over profitability in 2023 and 2024 if commodity prices decline while costs remain at current levels or have further increases. This article provides growth rates of direct costs – fertilizer, pesticides, and seed – from 2000 to 2022 using data from Illinois Farm Business Farm Management (FBFM) for corn production on high productivity farmland in central Illinois. This article builds on a previous article documenting cost changes from 1990 to 2015 (farmdoc daily July 12, 2016).
Costs tend to adjust upward with rising corn prices and corn revenue. However, cost adjustments have been more muted than price and revenue increases, and typically occur with a 1 to 2 year lag. Thus, expectations for continued cost increases for 2023 and into 2024 should be expected even if, as market expectations suggest, prices and revenues level off or decline relative to the high levels experienced over the most recent crop years.
Changes in Production Costs over Time
Table 1 reports per acre costs for fertilizer, pesticides, and seed on high-productivity farmland in central Illinois since 2000. Also included in table 1 are actual corn yields and prices received in the region over the same timeframe. Corn prices increased significantly from the mid-2000s through 2012, then declined to lower levels through 2019 before increasing again over the three most recent crop years.
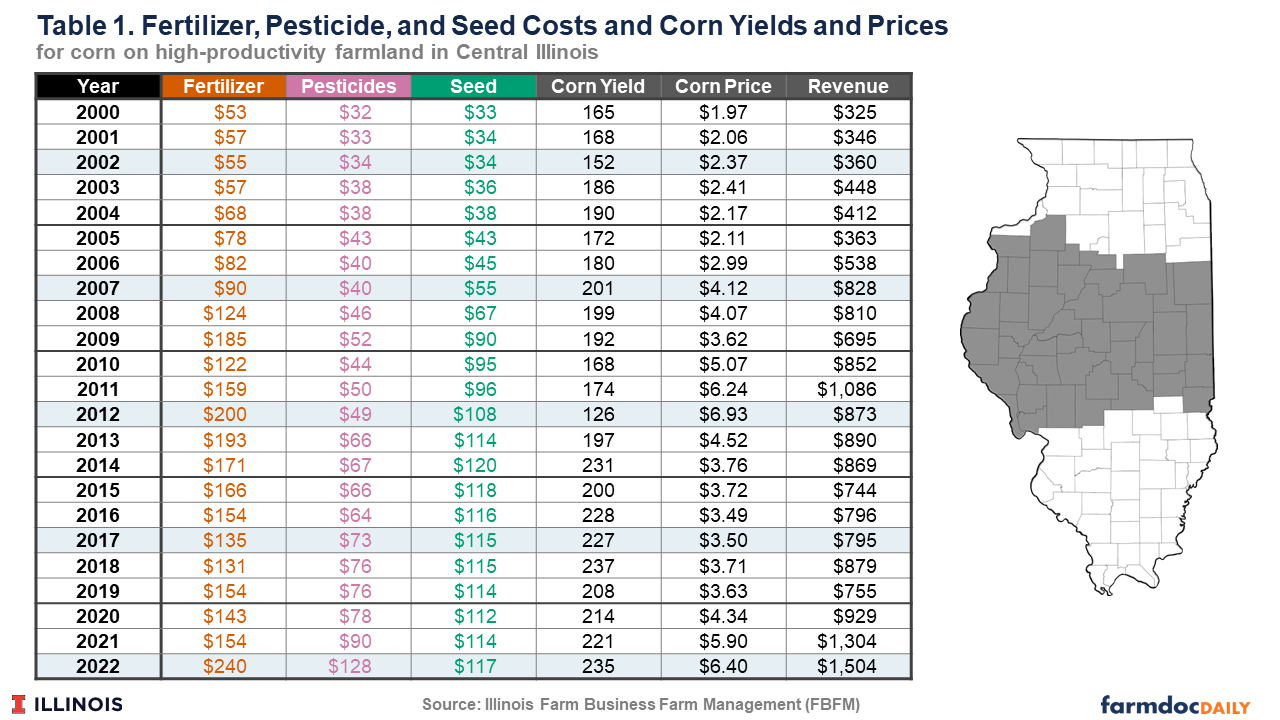
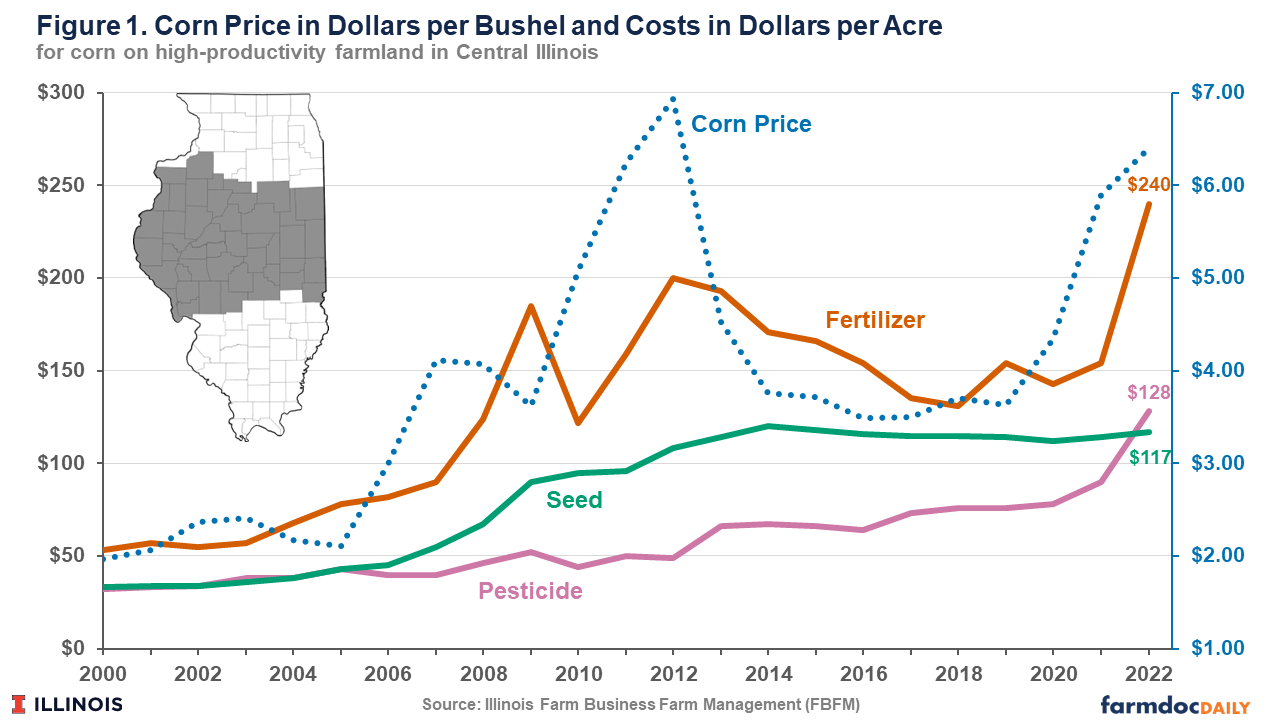
Figure 1 shows per acre costs of the major direct inputs have followed similar historical paths as that for corn prices. Corn prices generally trended upward from 2005 until 2012, fueled by rapid growth in demand for ethanol production as well as negative production shocks such as the 2012 drought. Fertilizer, seed, and pesticide costs also increased at a faster rate from the mid-2000s through 2014. For example, fertilizer costs experienced a spike in 2009 followed by a decline in 2010 and then growth until 2013. This was due to a number of factors including strong global fertilizer demand, low fertilizer inventories, and an increase in energy prices followed by softening global fertilizer demand and increased fertilizer supply, and higher volatility of fertilizer price compared to other input prices (Huang, McBride, and Vasavada, 2009).
From 2012 to 2014 corn prices declined and then leveled off through 2019. From 2014 to 2020, fertilizer and seed costs both leveled off and even declined while the rate of increase in pesticide costs became lower. Since 2020 corn prices and fertilizer and pesticide costs have increased dramatically, while the increase in seed cost per acre has ticked up slightly but remained relatively stable over the past 5 years.
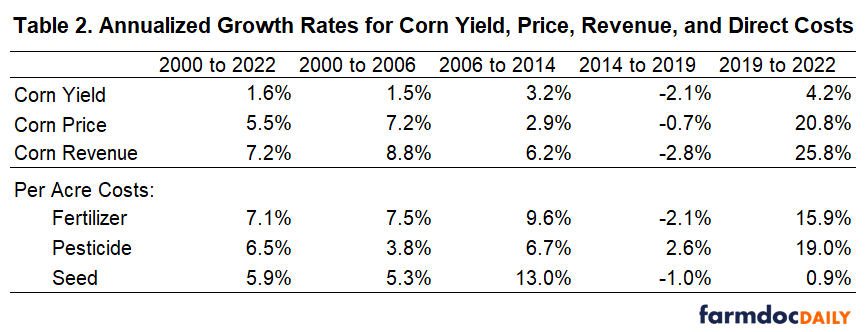
In summary, per acre costs for the main direct inputs have, historically, tended to follow corn prices with a 1-to-2-year lag. These correlations can be seen in Table 2, which shows annualized growth rates for different periods. Since 2000, input costs have all increased at a similar pace – 6 to 7% annually. This is comparable to annualized revenue growth over the same time period.
Revenue growth, led by increasing corn prices, outpaced input cost increases, in percentage terms, from 2000 to 2006. Growth in seed and fertilizer costs exceeded that for pesticide costs and crop revenues from 2006 to 2014. Revenues and fertilizer and seed costs declined moderately from 2014 to 2019, while pesticide costs continued to see moderate increases. Since 2019, fertilizer and pesticide costs have increased substantially relative to recent historical periods while seed costs have increased slightly. This coincides with another period of price-led increases in revenue.
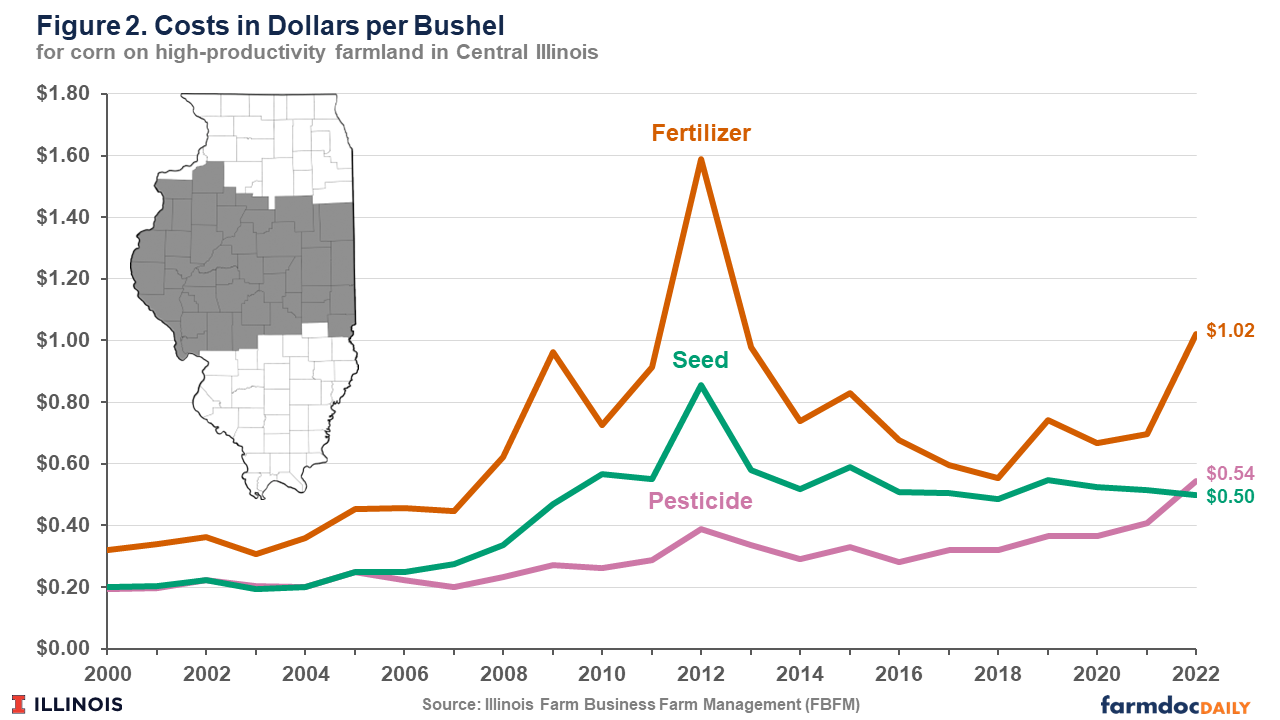
Input costs measured on a per bushel basis show similar patterns (see Figure 2), trending up more quickly from the mid-2000s through the spike in 2012 when corn yields were severely impacted by drought. Costs on a per bushel basis then declined for a few years and leveled through 2019. Larger increases in costs per bushel for fertilizer and pesticides have again been experienced over the past 3 years, while seed costs per bushel have actually realized a slight decline.
Finally, we provide historical costs for the three major direct input categories as a percentage of realized crop revenue in Figure 3. As a share of revenue, no obvious trend exists for costs associated with fertilizer, pesticides, or seed over the past 23 crop years. Cost shares vary across time but have averaged just over 17% of revenue for fertilizer, 8% for pesticides, and 11% for seed.

Summary
Unsurprisingly, history shows that input costs adjust to market conditions. Since 2000, fertilizer, pesticide, and seed costs have increased, on average, at roughly the same rate as corn revenues per acre – about 6 to 7% annually. Costs tend to increase more rapidly during periods of elevated prices, and can level off or decline during extended periods of lower prices. However, downward cost adjustments tend to occur with a 1- to 2-year lag relative to prices and revenues.
Market based indicators suggest commodity prices will likely be lower for the 2023 and 2024 crop years relative to levels in 2021 and 2022. Costs will likely continue to increase in 2023 and even into 2024 given the historical lag in adjustment timing. Producers should be aware and consider this as they finalize remaining input and marketing decisions for the 2023 crop and look ahead to those decisions for 2024.
The authors would like to acknowledge that data used in this study comes from farms across the State of Illinois enrolled in Illinois Farm Business Farm Management (FBFM) Association. Without their cooperation, information as comprehensive and accurate as this would not be available for educational purposes. FBFM, which consists of 5,000 plus farmers and 65 professional field staff, is a not-for-profit organization available to all farm operators in Illinois. FBFM field staff provide on-farm counsel with computerized recordkeeping, farm financial management, business entity planning and income tax management. For more information, please contact the State Headquarters located at the University of Illinois Department of Agricultural and Consumer Economics at 217-333-8346 or visit the FBFM website at www.fbfm.org.
References
Schnitkey, G. and S. Sellars. "Growth Rates of Fertilizer, Pesticide, and Seed Costs over Time." farmdoc daily (6):130, Department of Agricultural and Consumer Economics, University of Illinois at Urbana-Champaign, July 12, 2016.
Huang, W., W. D. McBride, and U. Vasavada. “Recent Volatility in U.S. Fertilizer Prices.” Amber Waves. USDS Economic Research Service, March 1, 2009. https://www.ers.usda.gov/amber-waves/2009/march/recent-volatility-in-us-fertilizer-prices/
Disclaimer: We request all readers, electronic media and others follow our citation guidelines when re-posting articles from farmdoc daily. Guidelines are available here. The farmdoc daily website falls under University of Illinois copyright and intellectual property rights. For a detailed statement, please see the University of Illinois Copyright Information and Policies here.