


Comparing Crop Insurance Net Farm Indemnities and Crop Production Profits
We compare net crop insurance indemnities paid to farmers with private market net returns from producing barley, corn, cotton, oats, peanuts, rice, sorghum, soybeans, and wheat over the 2009-2022 crop years. Collectively for the 9 crops, net indemnities paid to farmers nearly equal the net returns earned from producing these crops. The distributions of net indemnities and private market production incentives (i.e. net returns) differ nontrivially across the crops.
Data and Methods
Net indemnities paid to farms by crop insurance equals indemnities minus farm-paid premiums. Farm-paid premiums equal insurance premium minus Federal premium subsidy. The subsidy means farmers as a group will, over time, receive more indemnities than they pay in premiums (i. e. net farm indemnities exceed zero). Since the 2009 crop year for the 9 crops included in this study, farmers have paid 37% of crop insurance premiums while the Federal government has paid the other 63%. Because farmers do not pay the full crop insurance premium, crop insurance can be considered a crop payment program. Net farm indemnities are known to vary by crop (see farmdoc daily of January 17, 2023) and by state (see farmdoc daily of March 27, 2023).
This study starts with the 2009 crop year because it was the year during which the last major increase in premium subsidies was implemented, specifically the higher subsidies for enterprise insurance that the 2008 farm bill authorized (see Collins). Crop insurance indemnities and premiums come from the USDA, RMA (US Department of Agriculture, Risk Management Agency) Summary of Business.
Economic cost of production and net return per planted acre are also available for each crop from USDA, ERS (Economic Research Service). USDA, ERS assigns a cost to all inputs except management, including an opportunity cost to unpaid labor and farmer-owned land. It is thus an economic cost of production. Quantity of inputs is based on periodic surveys of farms. Input prices are updated annually using prices from NASS (National Agricultural Statistics Service) surveys. Net return is a private market return to management and risk at harvest. It does not include government payments (commodity, crop insurance, ad hoc, conservation, livestock, etc.), storage returns and costs, and farm-paid crop insurance premiums. In our judgement USDA, ERS data is a reasonable measure of cost and return to producing a crop in the US. We however encourage readers to examine the detailed discussion in Zulauf, Langemeier, and Schnitkey (2020) and form their own opinion.
Net Farm Indemnity
Because average coverage level varies by crop, subsidy level varies with coverage level, and crop prices and revenue have increased over time; net farm indemnity is examined as a ratio to insured liability. Over the 2009-2022 crop years, annual average of this ratio varied from 15% for cotton to 1% for soybeans (see Figure 1). Average ratio for corn is second lowest at 3%.

Private Market Net Return
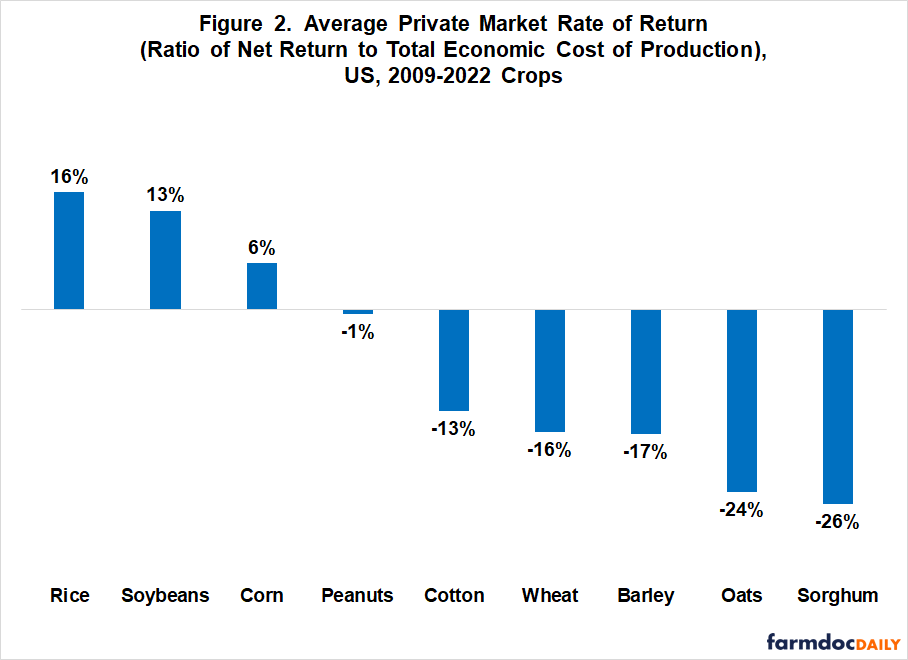
Because crop revenue varies by year, private market net return at harvest is examined as a ratio to economic cost of production. Annual average of this measure of rate of return varied from a profit of 16% for rice to a loss of -26% for sorghum (see Figure 2). Production of rice, soybeans, and corn generated, on average, a profitable private market rate of return while production of cotton, wheat, barley, oats, and sorghum, on average, resulted in a private market loss. Average rate of return to producing peanuts were close to breakeven.
Relationship between Net Indemnity and Net Return
A statistically significant, inverse relationship exists between private market rate of return and the ratio of net farm indemnities to insured liability (see Figure 3). Net farm indemnities are higher for crops with a lower private market rate of return. Explanatory power of 29% is not considered low for a single variable relationship.
A potential explanation of the relationship is that crops with lower market returns have more production losses. Over the 2009-2022 crop years, average percent deviation of harvest yield from its1974-2022 linear trend yield explained only 4% of the deviation of average private market rate of return among the 9 crops. This simple analysis suggests lower yields do not explain the variation in the average rate of private market returns for these crops during the 2009-2022 crop years. Whatever the explanation, over recent years the US crop insurance program has distributed payments across crops that only partially matches the distribution of private market incentives across crops.

Impact of Net Indemnities on Returns to Production
Crop insurance indemnity payments are tied to the intention to produce an insured crop. They thus can be considered a return to production of the insured crop. Net farm indemnities are paid to insured acres, but ERS cost of production and net return data are reported per planted acre. Not all planted acres are insured, and not all insured acres are planted; they could be prevent plant. FSA prevent plant acres as a share of NASS planted acres ranged from 0.4% for oats to 12.7% for rice over 2009-2022. Ratio of RMA insured acres to NASS planted acres plus FSA prevent plant acres ranged from 17% for oats to 96% for cotton. Only a small share of acres planted to oats are harvested. If oats is excluded, the lowest ratio is 72% for barley.
Because planted and insured acres differ, impact of net farm insurance indemnities on crop production profitability was examined by comparing the cumulative sum of net indemnities and cumulative sum of net returns over the 2009-2022 crop years for each crop and the 9 crops as a group. Total US net return earned from producing a crop in a year was computed by multiplying the ERS net return per planted acre for the year and crop by the acres NASS reported as planted to the crop.
Including net indemnities with net returns to production reduced losses from producing barley by 13% ($0.4 billion / -$2.7 billion), sorghum by 21% ($1.6 billion / -$7.8 billion), wheat by 28% ($9.8 billion / -$35.6 billion), and cotton by 67% ($11.2 billion / -$16.7 billion). They resulted in a profit for peanuts when production returns were breakeven, and increased profits from producing soybeans by 8% ($5.3 billion / $63.68 billion), rice by 34% ($2.0 billion / $5.8 billion), and corn by 45% ($24.6 billion / $55.3 billion). Soybeans had higher private market net return than corn ($63.6 billion for soybeans vs. $55.3 billion for corn), but corn had the higher net return when net farm indemnities were included ($79.9 billion for corn vs. $68.9 billion for soybeans).

When summed across the 9 crops, collective net indemnities nearly equaled collective private market net returns ($58.0 vs. $55.6 billion). Producers of these 9 crops thus earned nearly as much from crop insurance as from producing the 9 crops.
Discussion
This comparison of net crop insurance indemnities paid to farmers for 9 large acreage field crops with the net returns from producing these crops finds that, since the last major increase in crop insurance premium subsidies in 2009:
- Distribution of net indemnities across the 9 crops differs nontrivially from the distribution of private market production incentives (i.e. net returns) across the crops.
- Collectively for the 9 crops, net indemnities paid to farmers nearly equal the net returns earned from producing these crops.
Implications of these findings depend in part on whether farmers view payments from crop insurance differently from net private market returns to crop production? If net indemnities are seen as a net return to crop production, the deviation of insurance indemnities from net market returns could mean the US is producing less of the crops the market wants. Such a situation means that the US crop insurance program is providing an incentive for the rest of the world to expand production of the crops most in demand. The authors are unaware of any research that addresses how farmers view a dollar received from crop insurance vs. a dollar earned from producing the insured crop.
It is easy to understand why crop insurance has been the number one priority of farmers in recent farm bills given the size of net farm indemnities and farmers’ concern with production risks.
The size of net farm indemnities combined with the size of the difference in net farm indemnities across crops also prompts this question, “Should equality of payments across crops that compete in rotation decisions be a factor in setting crop insurance premiums?”
References and Data Sources
Collins, K. July 23, 2017. The Use of Enterprise Units in Crop Insurance. Mississippi State University Extension Agricultural Economics Blog. https://blogs.extension.msstate.edu/agecon/2017/07/23/the-use-of-enterprise-units-in-crop-insurance/
US Department of Agriculture, Economic Research Service. May 2023. Cost of Production. https://www.ers.usda.gov/data-products/commodity-costs-and-returns/
US Department of Agriculture, National Agricultural Statistics Service. May 2023. Quick Stats. https://quickstats.nass.usda.gov/
US Department of Agriculture, Risk Management Agency. May 2023. Summary of Business. https://www.rma.usda.gov/SummaryOfBusiness
Schnitkey, G., C. Zulauf, N. Paulson and J. Baltz. “Crop Insurance for Soybeans: The Low Loss Ratio Concern.” farmdoc daily (13):8, Department of Agricultural and Consumer Economics, University of Illinois at Urbana-Champaign, January 17, 2023.
Zulauf, C. and G. Schnitkey. “Is Loss Ratio a Sufficient Measure of Crop Insurance Performance?” farmdoc daily (13):55, Department of Agricultural and Consumer Economics, University of Illinois at Urbana-Champaign, March 27, 2023.
Disclaimer: We request all readers, electronic media and others follow our citation guidelines when re-posting articles from farmdoc daily. Guidelines are available here. The farmdoc daily website falls under University of Illinois copyright and intellectual property rights. For a detailed statement, please see the University of Illinois Copyright Information and Policies here.