


Mapping Food Flow Networks and the Food Supply Chain, Part 2
The United States plays a key role in a highly integrated global food system. Domestic transportation is key to the efficiency and resilience of domestic and international supply chains, making it important to understand its patterns. Further, food supply chains within the U.S. propagate and attenuate shocks, embody resources, and depend upon local infrastructure. Thus, estimates of how high-resolution food flows vary in time would enable a better assessment of risks in food supply chains, critical infrastructure, and sustainability.
In a previous article, we described two national databases of food flows within the United States and introduced our research to estimate food flows between U.S. counties (farmdoc daily, July 6, 2023). Here, we evaluate how fine-grained food flows vary in time (please refer to our original study for more details). We do this for all years with available data: 2007, 2012, and 2017. This means that we capture a major drought event in our data, since 2012 was a severe drought throughout the US Corn belt and Central Valley of California. We will dig into the drought event in the next article in this series.
Food Flow Networks
We estimate the food flows between all county pairs in the United States through time for each Standard Classification of Transported Goods (SCTG) agricultural and food commodity (See Table 1 in farmdoc daily, July 6, 2023 for the list of commodities).
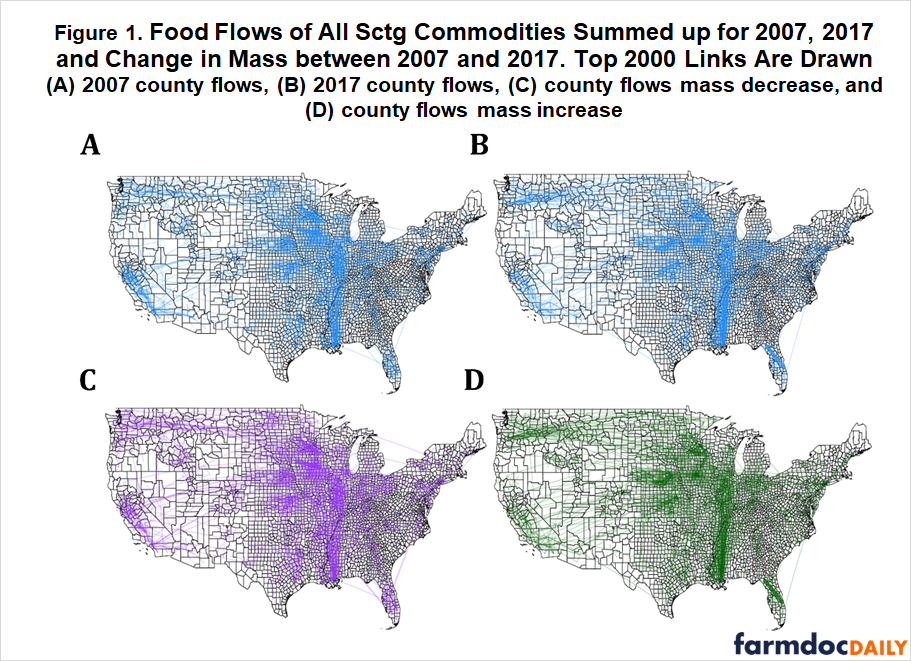
Figure 1 maps the change in food flow networks at county spatial scale over time. The blue networks show maps of food flows at county scale in 2007 and 2017. The green and purple networks show changes over that time period. As in the previous article, the county-scale networks capture the spatial patterns of the empirical Freight Analysis Framework (FAF) data reported by the U.S. Department of Transportation’s Federal Highway Administration. Thus, similar regions are highlighted as major mass flux corridors through time. For example, from 2007 to 2017, the Mississippi river-bend and Corn belt experience some of the largest fluctuations in food flows in both the empirical FAF data and our county scale estimates. There is also a relatively high variation in food flows within the counties of Florida, California, and inter-county flows of Washington.
The network statistics (i.e., density and total mass flux) for each SCTG commodity are plotted through time in Figure 2. The network density represents the number of existing connections over the number of all potential connections that can exist in the network. Thus, it represents how interconnected food flows are between counties within the U.S. per SCTG commodity. We observe that network density mostly increases with time (SCTG 01, 03, 04, 06, and 07), although there is some variation (SCTG 02, 05, and all commodities summed up decreases).
The total mass flux represents the amount of food transported between counties per SCTG commodity. It generally increases through time for each commodity. However, mass flux in 2012 was lower than in 2007 due to the 2012 drought in Corn belt and Central Valley which drastically reduced grain production and transport.
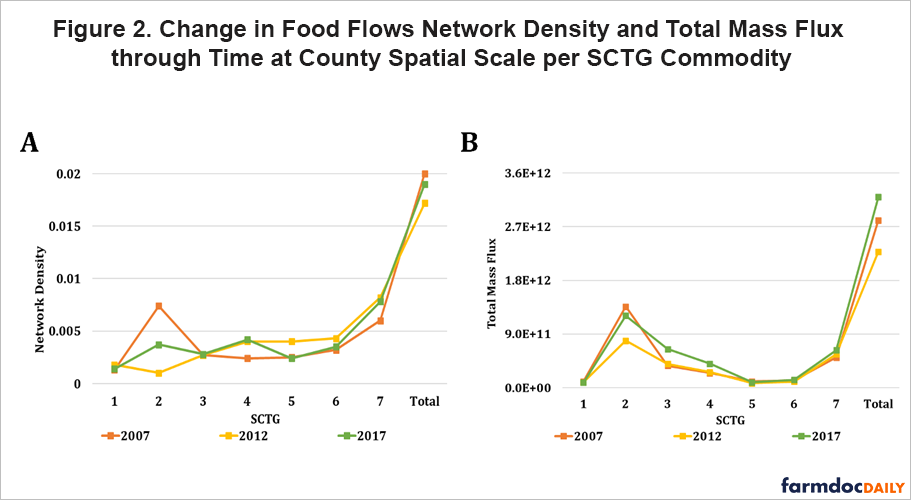
Across commodities, raw agricultural commodities such as SCTG 02 (cereal grains), SCTG 03 (agricultural products), and SCTG 04 (animal feed) generally account for higher total mass than more processed food commodities. However, SCTG 01 (live animals), SCTG 05 (meat and their preparation), and SCTG 06 (milled grain products and their preparation) have lower total mass as those account for a smaller portion of the total food market within the U.S. when they are compared with SCTG 02 (cereal grains) or SCTG 07 (other prepared food stuff and oils).
Food Inflows and Outflows By County
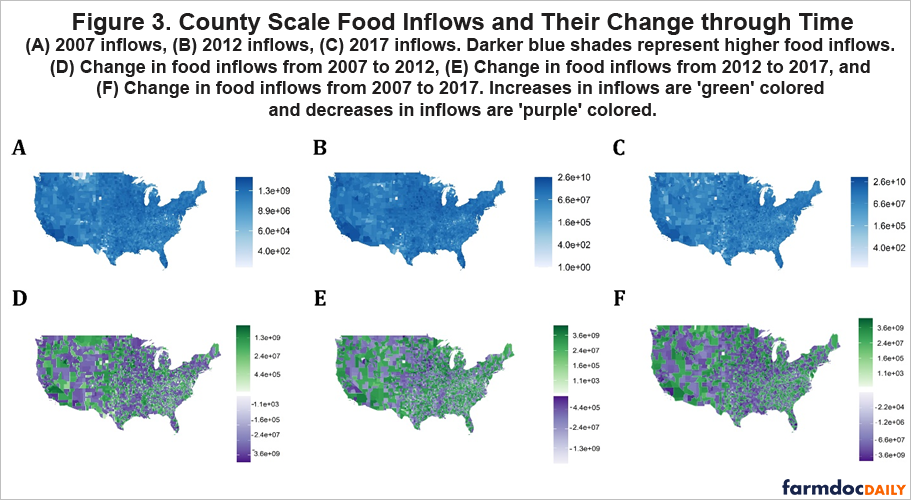
Food inflows for each county is illustrated in Figure 3, as well as the change in total inflows through time. The inflows generally increase, as the total mass flux of food increases from 2007 to 2017. More urban counties such as Los Angeles County, CA, Cook County, IL, New York County, NY, and King County, WA experience an increase in their food inflows through time as these are wealthy, major population centers, with extensive food processing facilities.
Generally, the inflows are relatively lower in Midwest and Central Valley counties as those are mainly considered as the food supply/production center of the U.S. However, we see an increase in inflows through time within these regions which could be explained by the increase in industry processing and consumption through time.
A different picture emerges for food outflows, as seen in Figure 4. More rural counties located in the South and Northwest send out higher amounts of food through time, and there is an increase in the total outflows due to the increase in total mass fluxes from 2007 to 2017. Important transit hubs, such as New Orleans, LA, Los Angeles, CA, and Chicago, IL, tend to have higher outflows, since these locations are receiving raw agricultural commodities and then sending out processed goods.
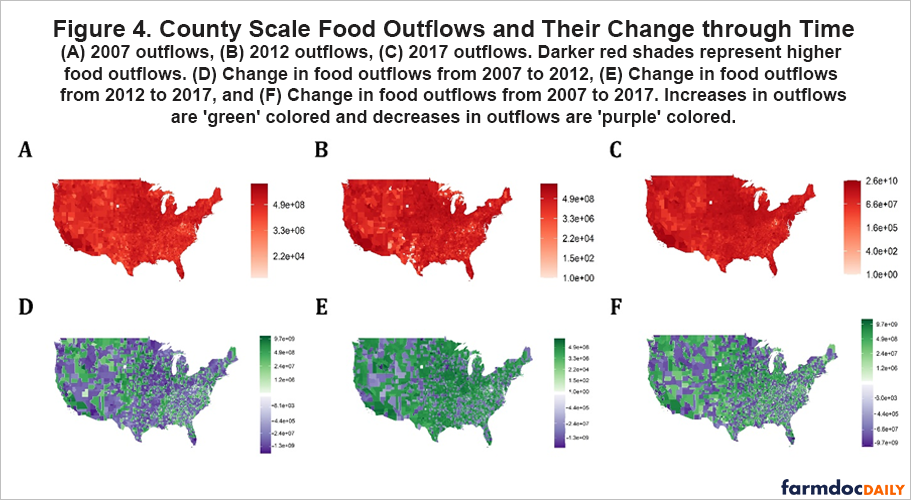
Similarly, Midwest and Central Valley counties have relatively high outflows when it is compared with the nation average through time. This is due to their ability to provide food commodities to the rest of the nation, especially for SCTG 02 (cereal grains) as these regions are specialized in grain production. Especially with the total mass flux increase from 2007 to 2017, outflow of counties located in Midwest and Central Valley also increases.
Core Locations
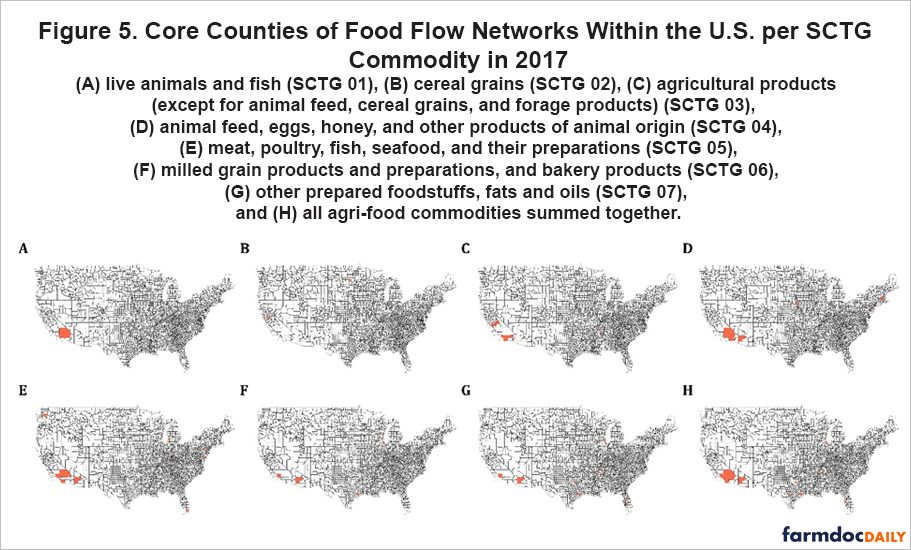
We determine the core locations to the US agri-food flow networks, as seen in Figure 5. Core locations are those that are highly connected and critical to the network structure of the national agri-food supply chain. The core locations tend to remain so through time, which indicates persistence in their importance. The consistently core counties through time are: Los Angeles County, CA, Cook County, IL, Maricopa County, AZ, Shelby County, TN, Riverside County, CA, Bexar County, TX and Harris County, TX. Core counties—which are defined in terms of their topological importance—are also major movers of food mass. This means that these counties are important in terms of both their contribution to network structure and mass flux. The core locations help us to identify the spatial locations that may be important to shore up to secure our national agri-food supply chains.
Implications
The spatially detailed maps of food flows through time that we have generated in this study (and make freely available at foodflows.org) gives us a better understanding on the spatiotemporal trends within the food supply chains of the U.S. The core locations highlight the places in which weather events or other disruptions are likely to have a greater impact than others. This information can be used to better assess and support our domestic food supply chain resilience, critical infrastructure, and sustainability.
References
Karakoc, D., J. Wang, and M. Konar. “Food Flows between Counties in the United States from 2007 to 2017.” Environmental Research Letters 2023(17) 034035, 17pp. DOI:10.1088/1748-9326/ac5270
Konar, M. and D. Karakoc. "Mapping Food Flow Networks and the Food Supply Chain, Part 1." farmdoc daily (13):124, Department of Agricultural and Consumer Economics, University of Illinois at Urbana-Champaign, July 6, 2023.
Disclaimer: We request all readers, electronic media and others follow our citation guidelines when re-posting articles from farmdoc daily. Guidelines are available here. The farmdoc daily website falls under University of Illinois copyright and intellectual property rights. For a detailed statement, please see the University of Illinois Copyright Information and Policies here.