


USDA and Market Analysts Agree on Key Supply and Demand Numbers
USDA corn and soybean supply and demand estimates released Friday, August 11 fell roughly in line with trade estimates. Updated World Agricultural Supply and Demand Estimates (WASDE) and Crop Production reports showed declines in projected US corn and soybean yield for 2023 based on National Agricultural Statistics Service survey data. Lower US production was widely anticipated before the report and the market reaction to the report release was muted. On Friday, new-crop December corn futures fell 9 cents to $4.87/bushel. Most of the decline came in the final minutes of trading as prices remained steady immediately after the report release. New-crop November 2023 soybean futures fell 12 cents to $13.07/bushel. Soybean futures prices moved slightly higher immediately after the report release before ending the day down overall.
The August reports provided respite from the often-withering criticism faced by USDA for the content and delivery of their supply and demand forecasts. On the heels of the substantial surprise in US corn and soybean planted acres in the June Acreage report (farmdoc daily, July 4, 2023), the August production and ending stocks estimates fell within the range of analysts’ forecasts and moved in the direction of analysts’ expectations relative to earlier USDA figures. The limited price reaction to the report release suggests the information in the report corroborated what is known (or at least what is widely agreed upon) about the availability of corn and soybeans in the year ahead.
When USDA and the Trade Agree
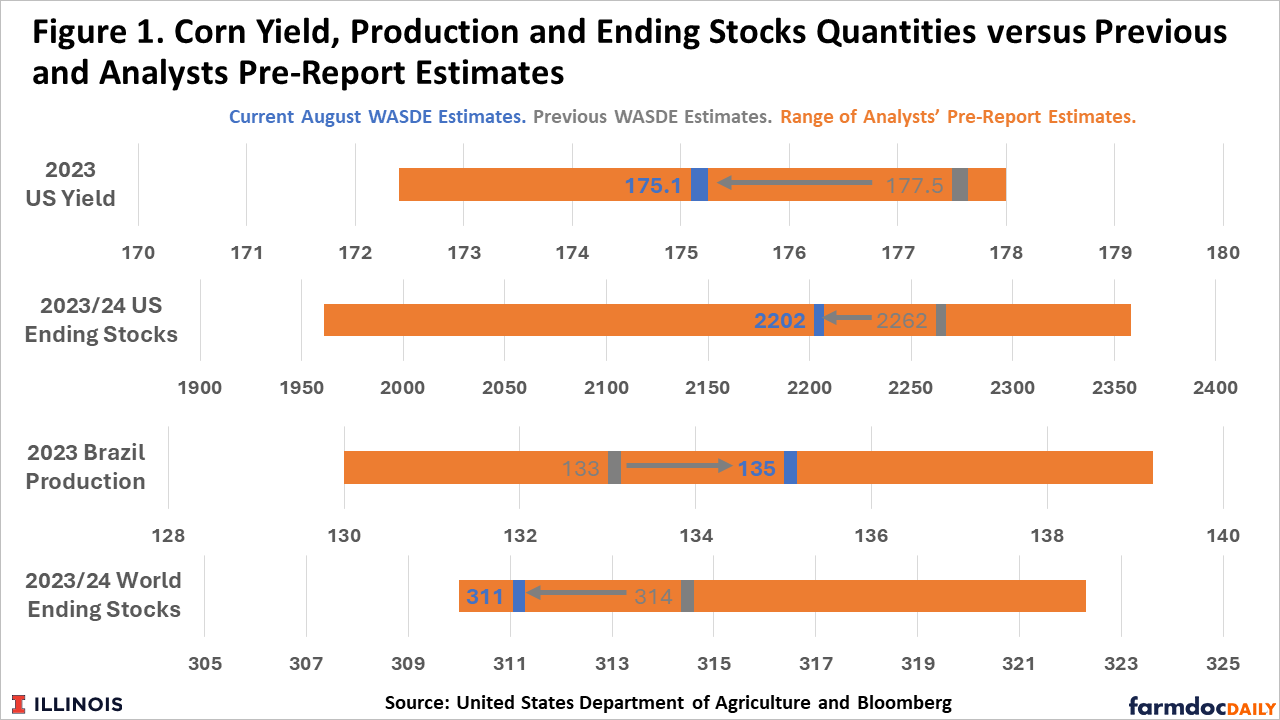
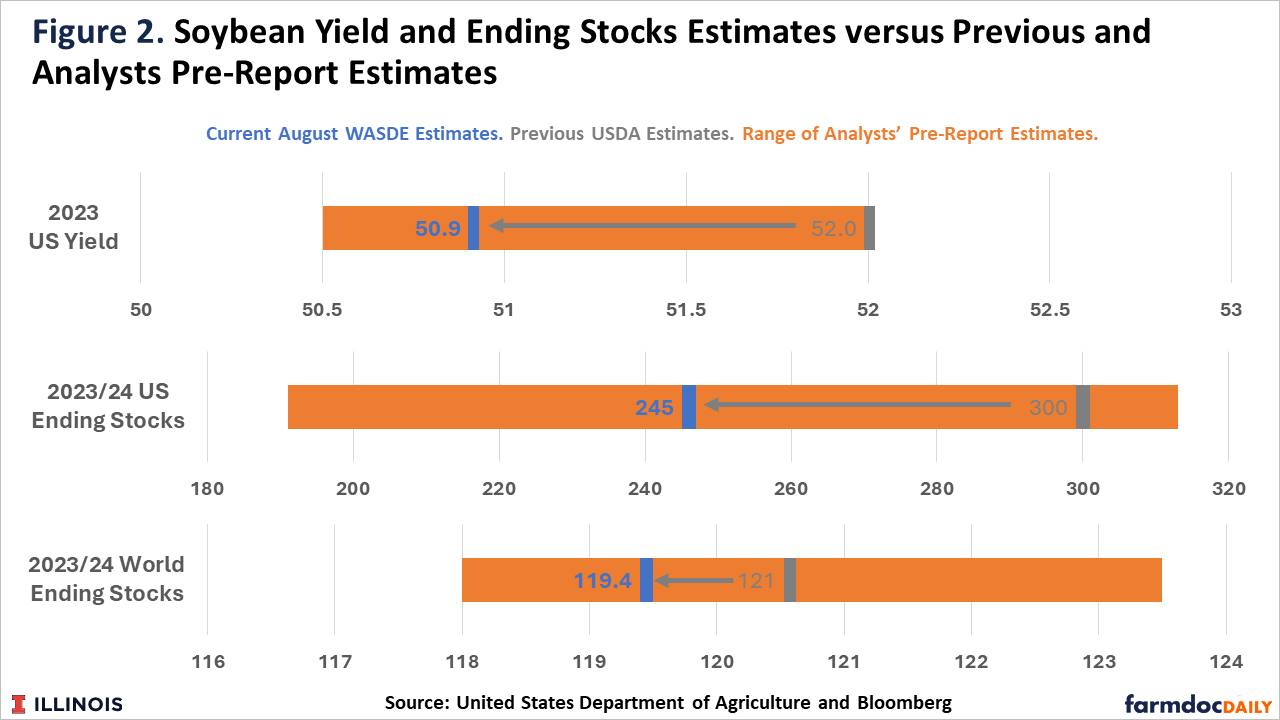
Figures 1 and 2 show the range of market analyst predictions about corn and soybean numbers released in the August WASDE report. Both figures include information on 2023 crop yield in the US and 2023/24 marketing year ending stocks in the US and the world. For corn, Brazil production is also shown since this figure remains in flux as Brazil wraps its second-crop corn harvest and plays a crucial role in the global supply and demand balance.
For corn, analysts largely predicted USDA would lower US yield and ending stocks with the bulk of analyst guesses falling below the previous USDA estimate. USDA did indeed lower corn yield from 177.5 to 175.1 bushels per acre. That level is well below the long-run trendline yield level of 181.5 bushels per acre, but an improvement from last year’s 172.3. USDA also lowered ending stocks to 2202 million bushels, but the decline was proportionally smaller than for yield as corresponding cuts to corn use (not covered in analyst surveys) were also made.
USDA did increase its 2023 Brazil production estimate from 133 million to 135 million metric tons. This followed the release of figures by Conab, the Brazilian agricultural supply agency, which showed a similar 2.2 million metric ton increase in estimated production. Both moves were generally anticipated by trade analysts. The net effect of these and other changes was a slight decline in world ending stocks for 2023/24. The current estimate of 311 million metric tons again remained in the range of analyst pre-report forecasts.
For soybeans, the relation between USDA figures and analyst forecasts was similar to corn. USDA dropped soybean yield from the trendline forecast of 52.0 bushels per acre to 50.9. As USDA had yet to update its yield forecast based on crop conditions and weather data (as it did for corn in July), lower yields were widely anticipated with nearly all surveyed analysts predicting lower yield numbers. Both US and world ending stocks were also lowered to levels within the range of trade guesses.
What It Means for New-Crop Supply and Demand Balance
The anticipated changes in key supply and demand indicators for corn and soybeans shown above did little to change the overall supply and demand picture given the US commodity balance sheet. Table 1 shows changes in all new-crop 2023/24 balance sheet quantities for both crops. Production declined 209 million bushels for corn and 95 million bushels for soybeans from the month prior. Decreases in use covered about half of the production decline for corn and about 30% for soybeans. For corn, exports declined the most.
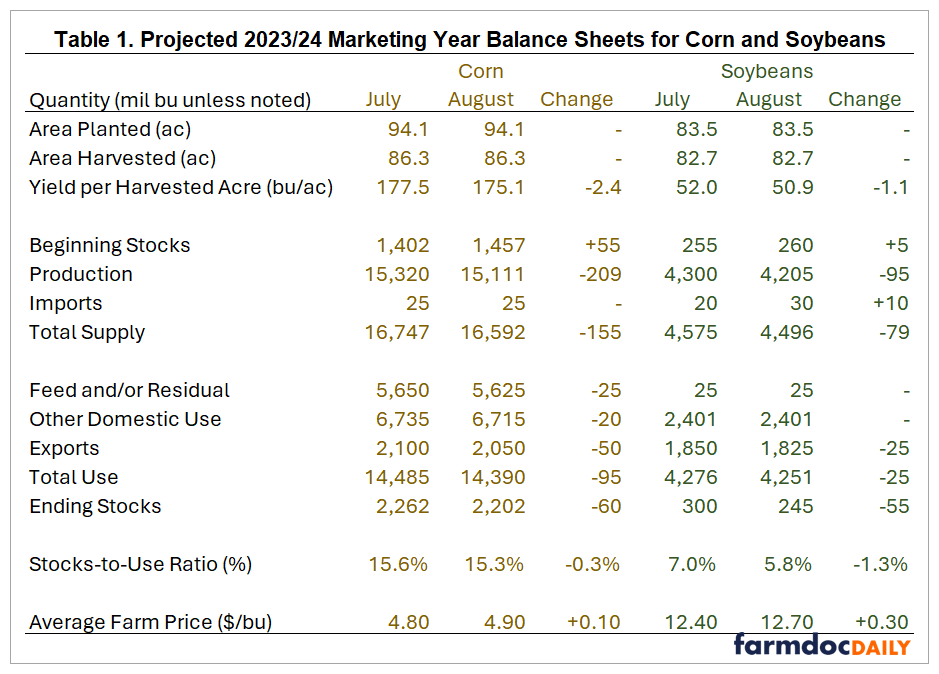
The current new-crop export projection in Table 1 is optimistic, especially relative to US corn export performance in 2022/23. USDA currently projects new-crop corn exports of 2,050 million bushels compared to old-crop exports of just 1,625. It is unclear whether US corn exports can manage a roughly 25% year-over-year increase in the face of large Brazilian old-crop production plus continued competition from both Brazil’s 2024 crop and an almost certain rebound in Argentina’s corn production following drought.
Overall, expected corn availability remains at levels that must be viewed as burdensome for price levels. The combined effect of production and use changes in the August report was a decline in the stocks-to-use ratio of 0.3 percentage points to 15.3%.
For soybeans, USDA made small adjustments to use. New-crop exports were lowered 25 million bushels and domestic use was left unchanged. The relative strength in domestic soybean demand resulted in a more substantial decline in the soybean stocks-to-use ratio compared to corn. At 5.8% stocks-to-use, the soybean supply and demand balance is expected to remain tight for a third consecutive marketing year.
Discussion
Production numbers released by USDA in the August reports are projections; there will be considerable attention paid to crop conditions and how they might change these numbers in the next month or so. There are some questions about the extent to which recent favorable weather in the US Corn Belt was incorporated into both USDA and analyst forecasts. Good growing conditions may have arrived in time to boost yield, particularly for soybeans, so that the current USDA yield estimate may be too low. The limited price reaction to the report release suggests current USDA production estimates largely corroborated what was known about the size of the US crop.
The August report did not change the overall tenor of the US corn and soybean balance sheets. Forthcoming changes in corn yield at levels similar to past month-to-month changes will do little to alter the impact of 94.1 million US corn acres. The corresponding production quantity implies a sub-$5 corn price and lower volatility than we’ve seen in the past two years. The soybean balance sheet remains far tighter and soybean price volatility is expected to continue into the new crop year.
References
Janzen, J. "Corn and Soybean Moving in Opposite Directions." farmdoc daily (13):122, Department of Agricultural and Consumer Economics, University of Illinois at Urbana-Champaign, July 4, 2023.
Disclaimer: We request all readers, electronic media and others follow our citation guidelines when re-posting articles from farmdoc daily. Guidelines are available here. The farmdoc daily website falls under University of Illinois copyright and intellectual property rights. For a detailed statement, please see the University of Illinois Copyright Information and Policies here.