


FSA Acreage Data Could Imply Higher Ending Stocks and Lower Prices
A prior farmdoc study (Irwin and Hubbs 2020) uses a two-step approach to show that, as early as August, FSA numbers offer a fairly accurate projection of the final acreage estimates reported in the NASS Annual Summary in January. Here, the relationships within that two-step approach are updated based on just the most recent two years. Given that the just released FSA numbers are reported as of August 9, and corresponding releases were as of August 2 in 2021 and August 22 in 2022, these last two years should, on average, closely approximate relationships for the current data, as prior years generally reflect acreage enrollments as of August 1, which tend to increase throughout the season. First, with respect to the FSA data, corn and soybean acreage enrolled in farm programs by August respectively average 99.3% and 99.4% of that in January, which reflects modest increases in enrollment over the season. Second, January FSA acreage numbers for corn and soybeans respectively average 98.0% and 99.0% of NASS estimates in the January Annual Summary. These average statistics can be applied to August FSA acreage data to produce planted acreage estimates that can substituted for those in the supply and demand balance sheets of WASDE reports, thereby offering further insights for price outlook. Thus, alternative final planted acreage estimates can be produced as shown below.
| FSA August Planted Acreage | Step1:
Assumed Ratio Preliminary/Final |
Step 2: Assumed Ratio FSA/NASS | Estimated Final FSA Planted Acreage | ||||
| Corn | 93,030,602 | ÷ | 99.3% | ÷ | 98.0% | = | 95,583,606 |
| Soybeans | 82,615,421 | ÷ | 99.4% | ÷ | 99.0% | = | 83,996,130 |
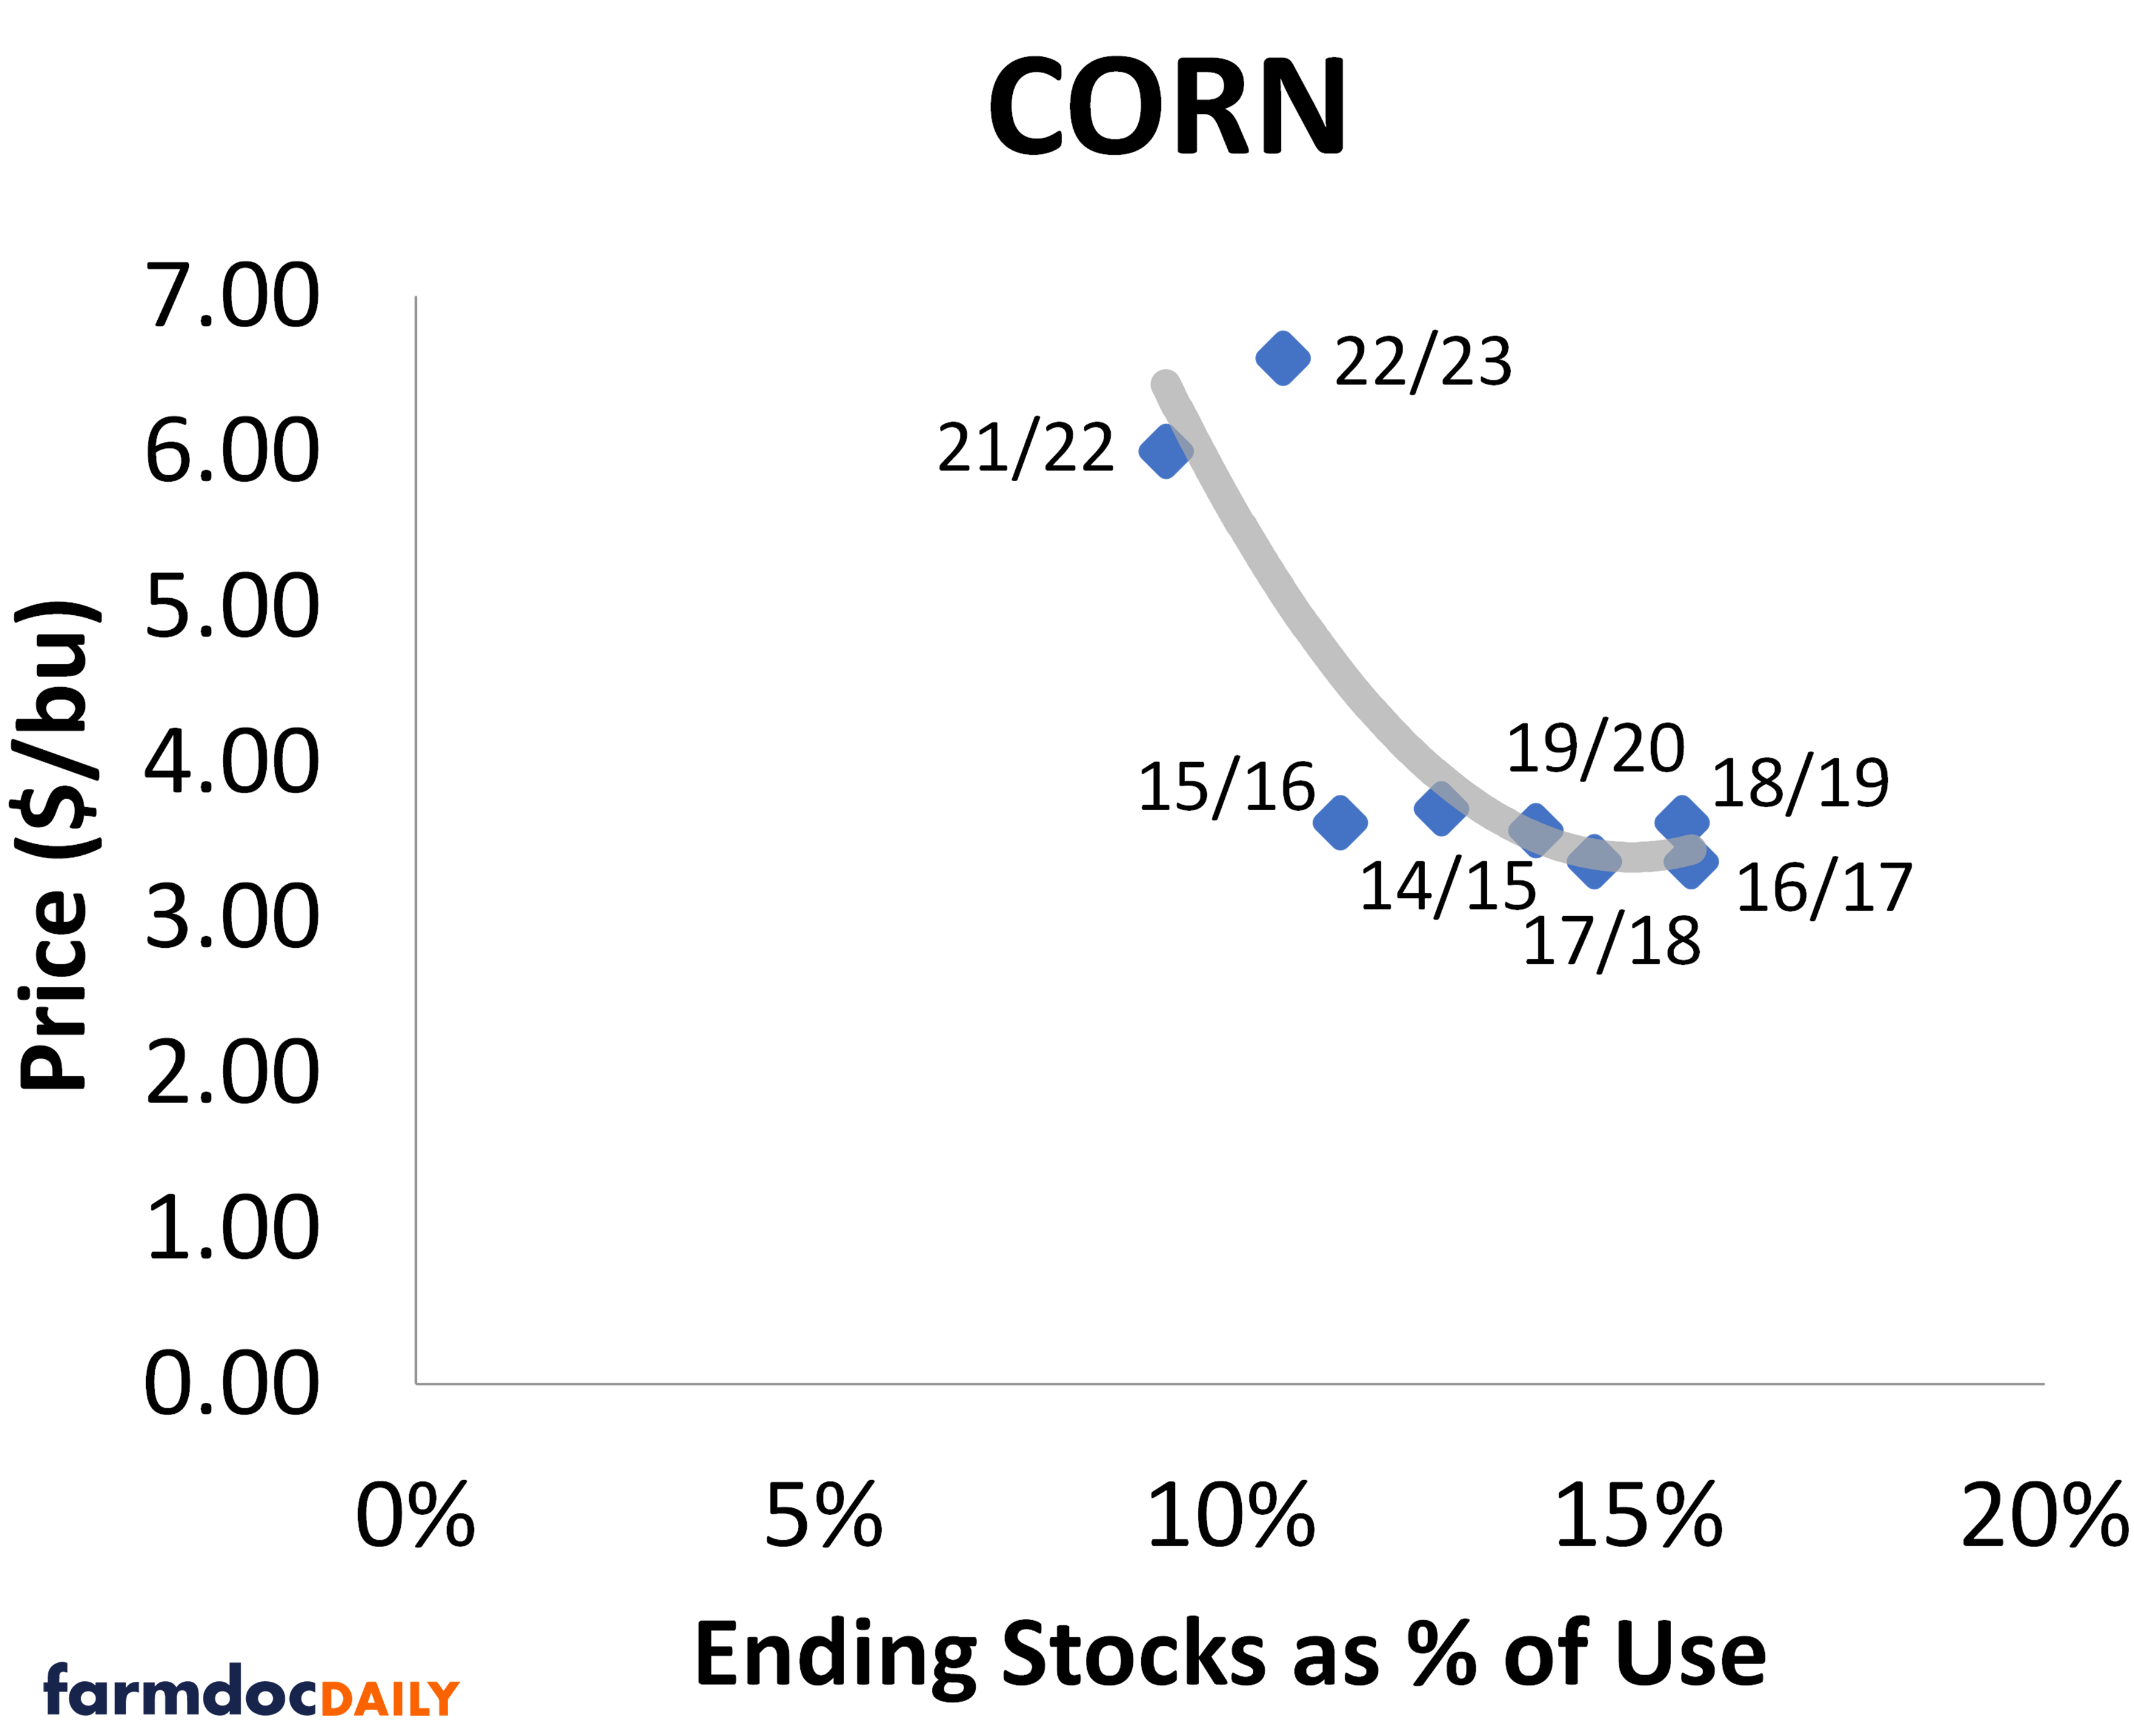
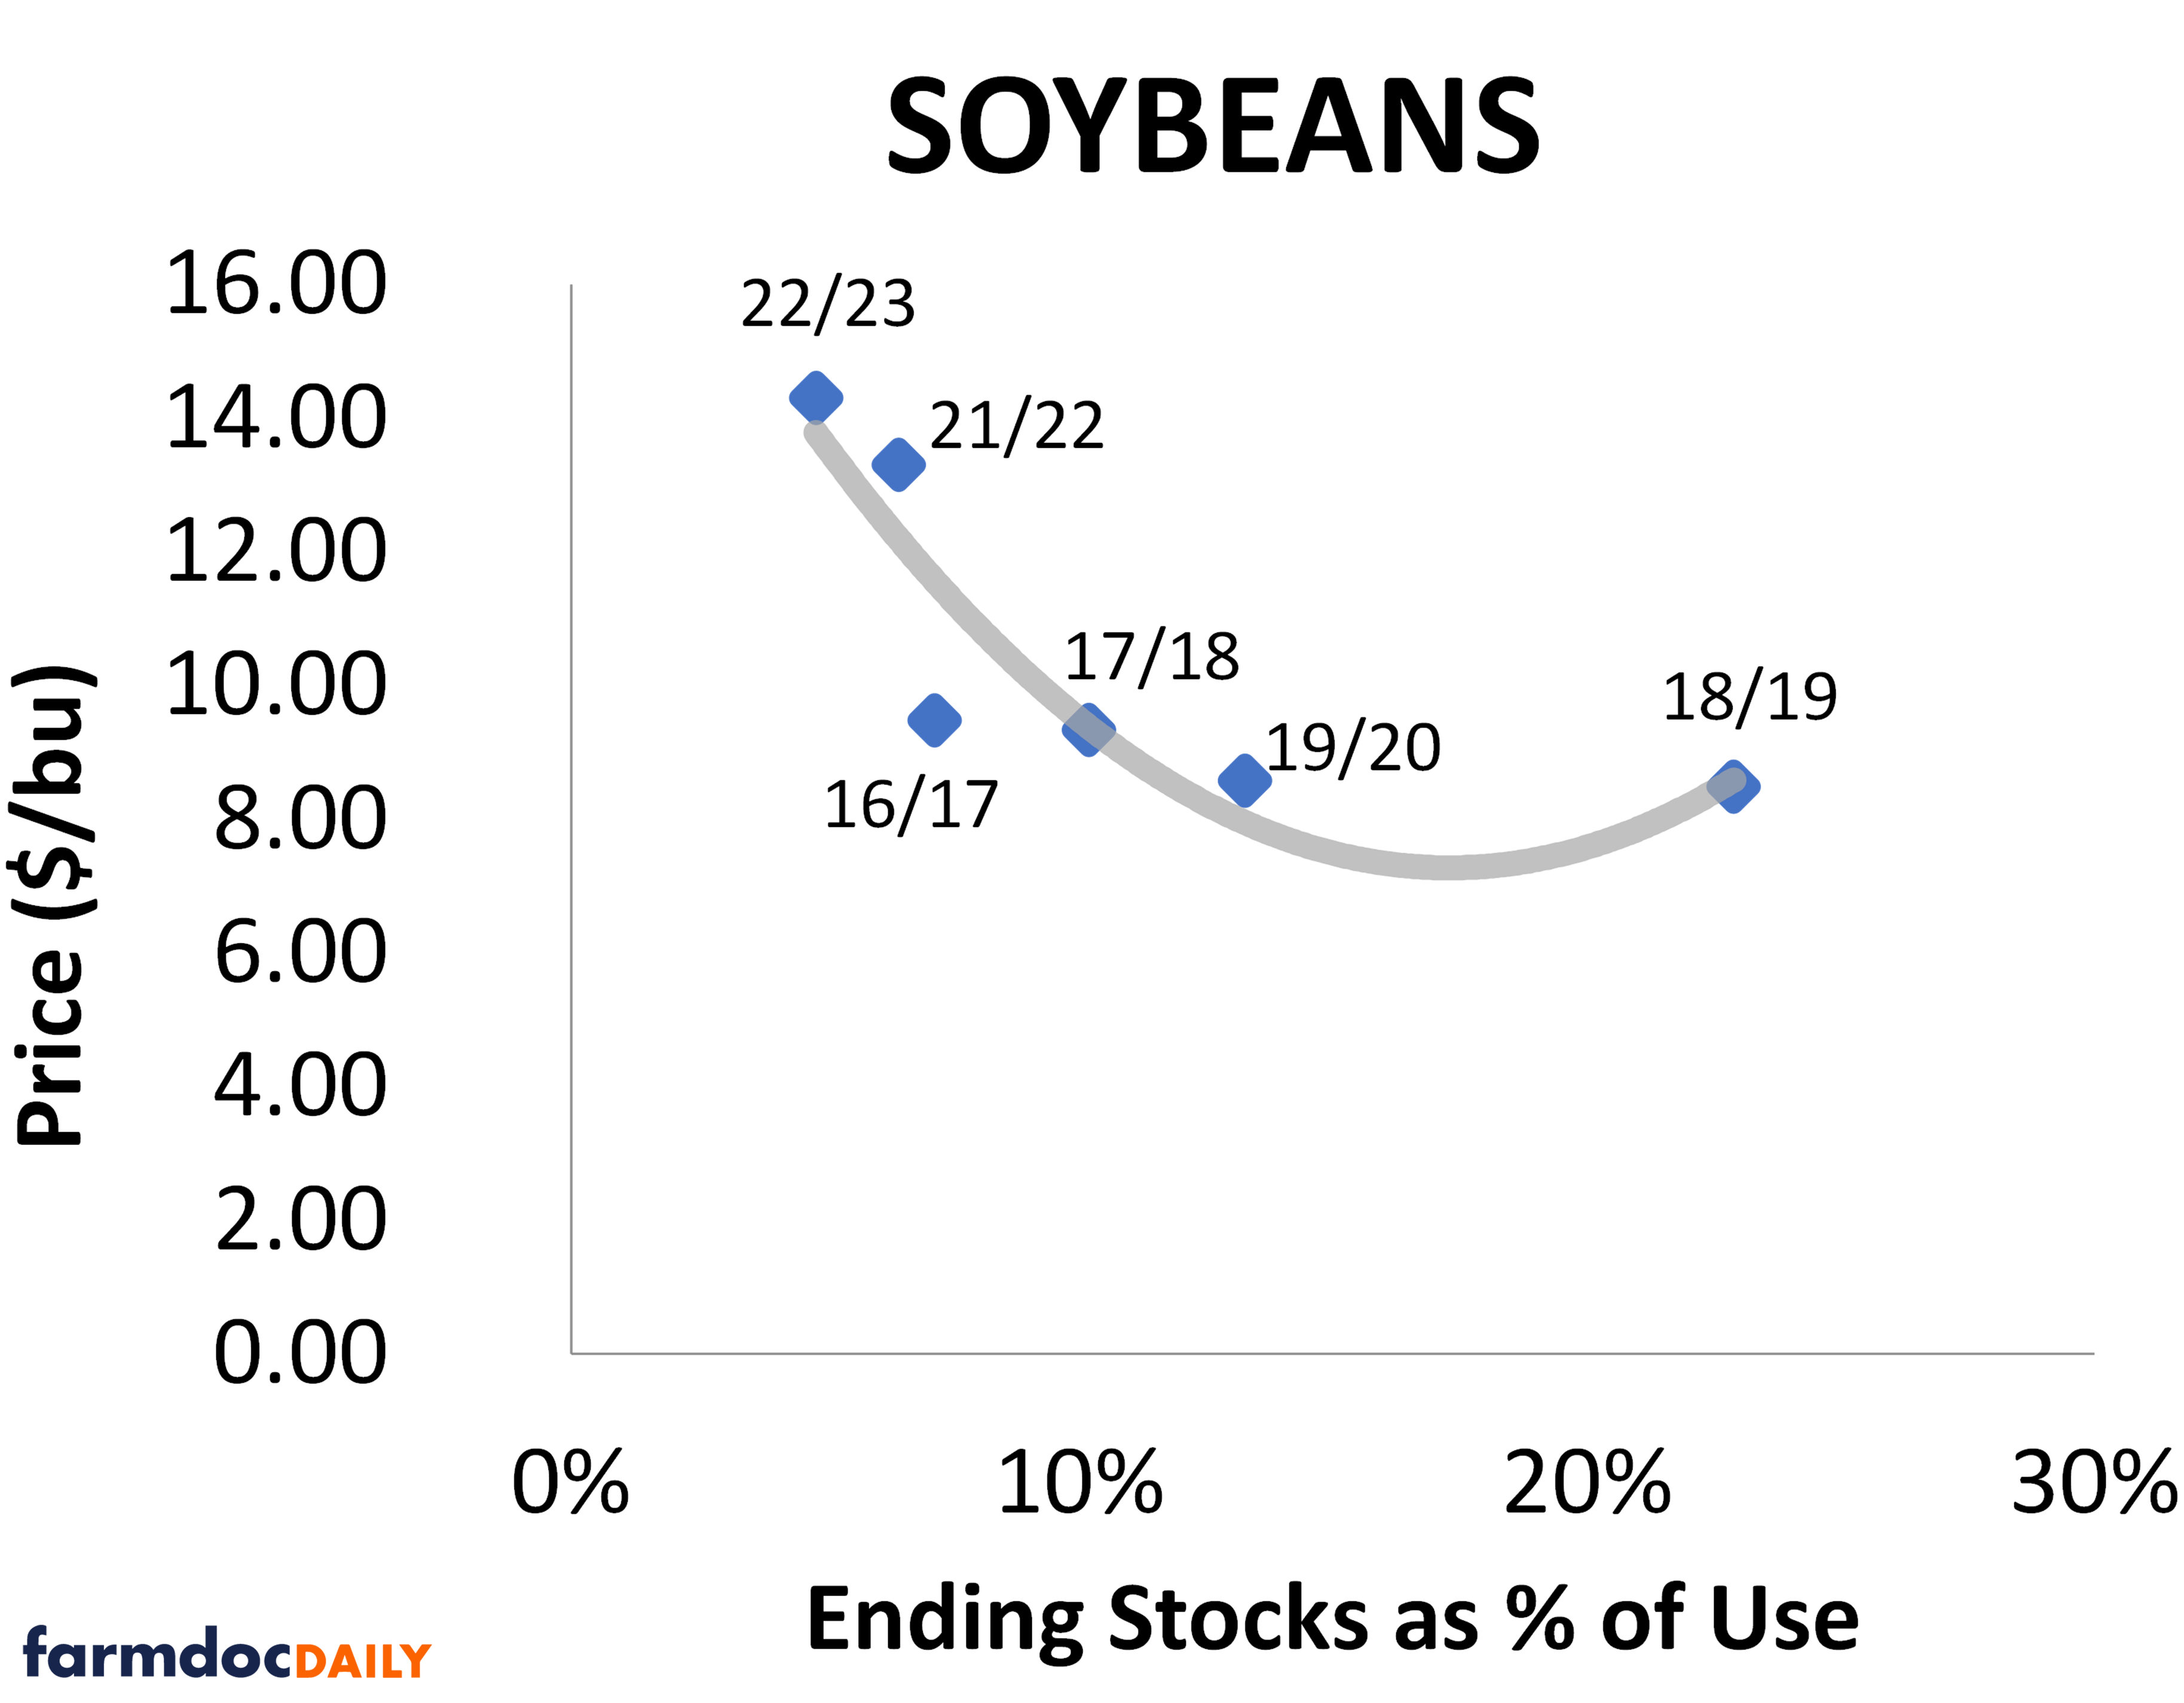
Replacing the WASDE acreage estimates with those obtained here, and retaining other assumptions from the WASDE supply and demand balance sheet facilitates an alternative outlook and corresponding price projections. The analysis of FSA data suggests that planted acreage could be 1.6% higher for corn and 0.6% higher for soybeans than indicated by the WASDE report. Assuming the same percentage of planted acres harvested (92% for corn and 99% for soybeans), the larger FSA-based planted acreage estimates translate into more harvested acres. Adopting the same yields, beginning stocks, and imports implies greater supply that, combined with identical assumptions about disappearance, lead to higher ending stocks relative to total use, which should suggest lower prices. Given that supply and demand jointly determine price in economic theory, the stocks-to-use ratio, which reflects the supply carried over after meeting demand for that crop year, should be inversely related to price and is commonly considered, among other things, in price forecasts for storable agricultural commodities. Here, statistical models approximate those relationships depicted graphically below and project annual average prices of $4.61/bu for corn and $12.19/bu for soybeans.
| Corn | Aug WASDE | farmdoc Forecast | Soybeans | Aug WASDE | farmdoc Forecast |
| Area Planted (mil. acres) | 94.1 | 95.6 | Area Planted (mil. acres) | 83.5 | 84.0 |
| Area Harvested (mil. acres) | 86.3 | 87.7 | Area Harvested (mil. acres) | 82.7 | 83.2 |
| Yield (bu./acre) | 175.1 | 175.1 | Yield (bu./acre) | 50.9 | 50.9 |
| Beginning Stocks (mil. bu.) | 1,457 | 1,457 | Beginning Stocks (mil. bu.) | 260 | 260 |
| Production (mil. bu.) | 5,111 | 15,349 | Production (mil. bu.) | 4,205 | 4,234 |
| Imports (mil. bu.) | 25 | 25 | Imports (mil. bu.) | 30 | 30 |
| Total Supply (mil. bu.) | 16,592 | 16,831 | Total Supply (mil. bu.) | 4,496 | 4,524 |
| Feed and Residual (mil. bu.) | 5,625 | 5,625 | Crushings (mil. bu.) | 2,300 | 2,300 |
| Food, Seed & Indust (mil. bu.) | 6,715 | 6,715 | Seed (mil. bu.) | 101 | 101 |
| Ethanol & biproducts (mil. bu.) | 5,300 | 5,300 | Residual (mil. bu.) | 25 | 25 |
| Domestic Total (mil. bu.) | 12,340 | 12,340 | Domestic Total (mil. bu.) | 2,426 | 2,426 |
| Exports (mil. bu.) | 2,050 | 2,050 | Exports (mil. bu.) | 1,825 | 1,825 |
| Total Use (mil. bu.) | 14,390 | 14,390 | Total Use (mil. bu.) | 4,251 | 4,251 |
| Ending Stocks (mil. bu.) | 2,202 | 2,441 | Ending Stocks (mil. bu.) | 245 | 273 |
| Ending Stocks/Total Use (%) | 15.30% | 16.97% | Ending Stocks/Total Use (%) | 5.76% | 6.43% |
| Average Farm Price ($/bu.) | $4.90 | $4.61 | Average Farm Price ($/bu.) | $12.70 | $12.19 |
Note: Bolded statistics differ from WASDE due to substitution of FSA-based acreage estimates.
As a caveat, in the last two years used to model the FSA-NASS acreage relationships, FSA reported acreage enrollments have grown less from August to January than in the past, and January FSA and NASS data have been more similar, which may reflect greater enrollment of planted acres in farm programs. If those trends continue, then the approach used here could overestimate acreages and underestimate prices somewhat, but if this year turns out be more like earlier years, then even higher acreages and lower prices may be realized. These points coupled with the yield implications of much needed rains falling around the release of the last WASDE report and since, suggest it is prudent to think about downside risk management.
YouTube Video: Discussion and graphs associated with this article at
View Slides: https://farmdocdaily.illinois.edu/wp-content/uploads/2023/08/2023-8-16-Farmdoc-Franken.pdf
References
Irwin, S. and T. Hubbs. "Using Preliminary FSA Data to Project Final Planted Acreage for Corn and Soybeans." farmdoc daily (10):156, Department of Agricultural and Consumer Economics, University of Illinois at Urbana-Champaign, August 27, 2020.
Disclaimer: We request all readers, electronic media and others follow our citation guidelines when re-posting articles from farmdoc daily. Guidelines are available here. The farmdoc daily website falls under University of Illinois copyright and intellectual property rights. For a detailed statement, please see the University of Illinois Copyright Information and Policies here.