The Biodiesel Profitability Squeeze that Wasn’t
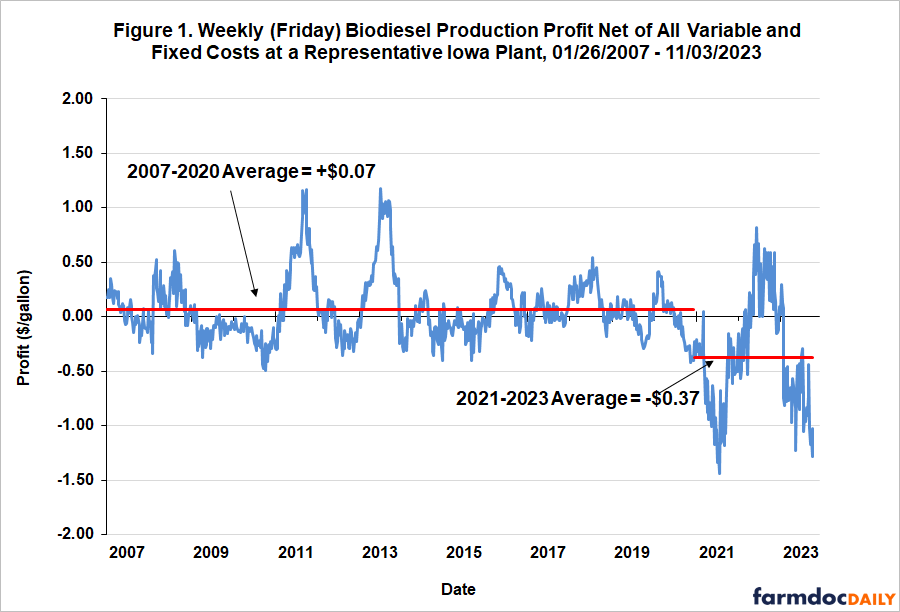
A farmdoc daily article earlier this year (May 10, 2023) analyzed the impact of the renewable diesel boom on FAME biodiesel production profits. The analysis showed that competition from rapidly rising renewable diesel production since 2021 had dramatically squeezed the profitability of biodiesel production. For example, the average profit for a representative Iowa FAME biodiesel plant over 2007-2020 was estimated to be +$0.07 per gallon. With the onset of the renewable diesel boom, average profit plunged to -$0.27 per gallon over 2021-2023. The same article noted that despite the severity of the losses only a relatively modest amount of FAME production capacity has been mothballed. The only explanation offered for this puzzling behavior was the financial cushion provided by a period of profitability in 2022. There is another possible explanation for the behavior of biodiesel producers. In short, producers may have been behaving rationally because the magnitude of losses was substantially over-estimated in the earlier article. The purpose of the present article is to investigate potential sources of bias in estimates of FAME biodiesel production profits during recent years. This is the 10th in a series of farmdoc daily articles on the renewable diesel boom (see the complete list of articles here).
Analysis
The farmdoc daily article of May 10, 2023 used a model of a representative Iowa biodiesel plant to assess production profitability. The model is a modified version of the representative FAME biodiesel plant model developed by Don Hofstrand at Iowa State University, and it has been used in numerous farmdoc daily articles (e.g., February 5, 2020, February 3, 2021, February 16, 2022). See the May 10th article for details on the latest model assumptions. Figure 1 presents updated estimates of FAME production profits net of all variable and fixed costs through November 3, 2023. Since the previous article was published, estimated losses have continued at historic levels, to the point where the average loss during the renewable diesel boom (2021-2023) increased to -$0.37 per gallon. Estimated losses exceeded -$1 per gallon in October 2023.
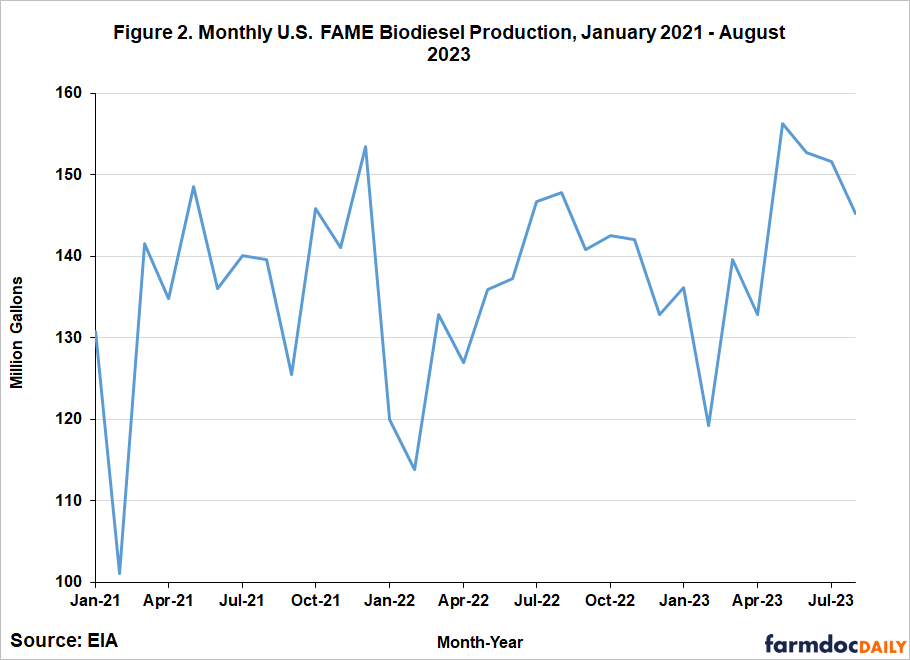
The next step of the analysis is to review the data on biodiesel production during the renewable diesel boom. Figure 2 shows monthly FAME biodiesel production in the U.S. over January 2021 through August 2023. There clearly is not an overall downtrend in biodiesel production over this period, despite the huge losses shown in Figure 1. The most surprising result is the large increase in production during 2023 after a seasonal low in February, with the peak in production of 156 million gallons in May 2023 exceeding the previous high for the period set in December 2021. This is completely counter to what one would expect based on production losses that were generally estimated to be at least -$0.50 per gallon.
Fortunately, it is relatively easy to verify the production trends presented in Figure 2, which is based on data collected by the Economic Information Agency (EIA) of the Department of Energy. Figure 3 adds to the chart domestic D4 biodiesel RIN generation (1.5 RINs per physical gallon), based on data provided by the Environmental Protection Agency (EPA). RINs are generated when biofuel is produced and used by obligated parties to demonstrate compliance with Renewable Fuel Standard (RFS) mandates. While biodiesel RIN generation does not perfectly track physical biodiesel production, the correlation is close enough to verify that biodiesel production has not fallen precipitously during the renewable diesel boom.
At this point, we can be confident that the contradiction between biodiesel profits and production is not due to problems with the production data. Therefore, the next logical step is a careful examination of the assumptions and data used in the representative FAME biodiesel plant model to estimate production profits. A key assumption of the model is the number of pounds of soybean oil used per gallon of biodiesel produced. This has been assumed to be between 7.50 and 7.55 pounds per gallon for the entire time we have used the model. This range was cross-checked and confirmed in previous farmdoc daily articles (e.g., February 16, 2022) using EIA biodiesel feedstock data through 2020. While more recent data is not available, it is reasonable to assume that the conversion coefficient has remained nearly constant in recent years given that the production technology in FAME biodiesel plants has not changed substantially over time (see the farmdoc daily article on February 8, 2023 for additional details).
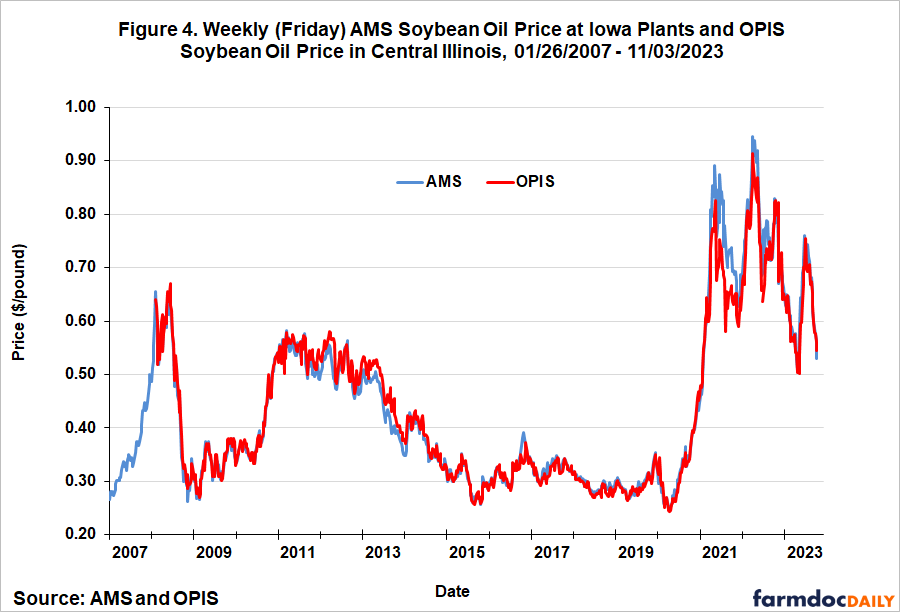
If the production technology assumptions in the representative plant model are reasonably accurate, the next step is to examine the price data that is used to estimate input costs and output revenue. Since the cost of soybean oil represents over 80 percent of total variable and fixed costs of production, problems in the measurement of soybean oil prices could bias profit estimates. The plant model uses weekly soybean oil prices at Iowa plants from the Agricultural Marketing Service (AMS) of the U.S. Department of Agriculture (USDA). The weekly AMS Iowa soybean oil prices over January 26, 2007 through November 3, 2023 are presented in Figure 4. The chart also includes central Illinois soybean oil prices from OPIS, which serve as independent check on AMS soybean oil prices. These prices are available starting in March 2008. If the AMS soybean oil prices are causing biodiesel production profits to be under-estimated during the renewable diesel boom, we should see AMS prices that are unusually high relative to the OPIS soybean oil prices starting in 2021. Examination of Figure 4 shows that this is not the case, as the price series track one another quite closely despite the huge volatility in soybean oil price movements over 2021 through 2023. The relationship has been particularly close during the last year.
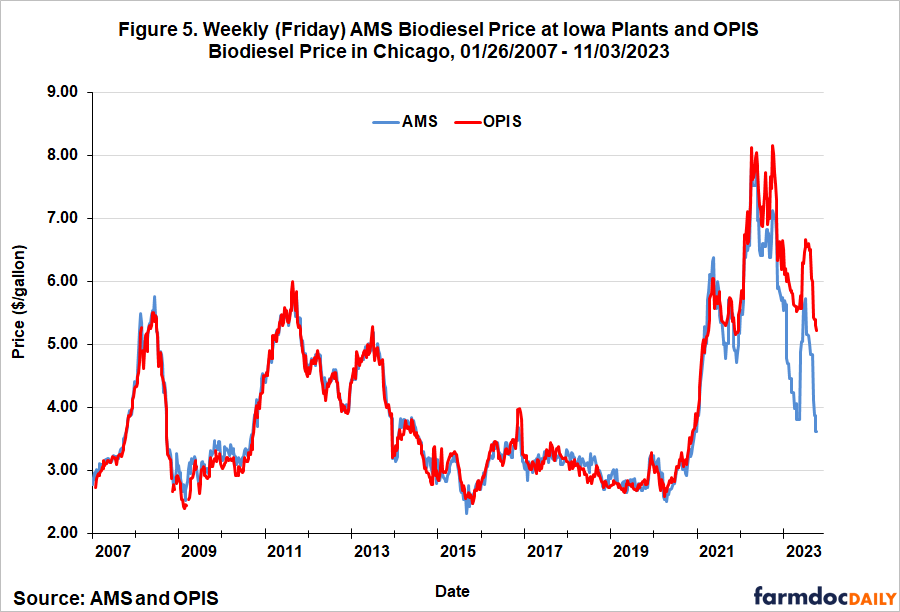
We now turn our attention to the revenue side of the representative plant model. Since biodiesel revenue represents an average of 98 percent of total revenue, problems in the measurement of biodiesel prices could obviously bias profit estimates. As with soybean oil prices, the plant model uses weekly biodiesel prices at Iowa plants from the Agricultural Marketing Service (AMS) of the USDA. The weekly AMS Iowa biodiesel prices over January 26, 2007 through November 3, 2023 are presented in Figure 5. The chart also includes Chicago biodiesel prices from OPIS, which serve as the independent check in this case. These prices are available starting in February 2007. Like soybean oil prices, the price series track each other very closely through 2020. For perspective, the average difference between the two biodiesel prices over 2007-2020 is only +$0.03 and the correlation coefficient for the two series is 0.99. After 2020 there is a clear and unmistakable change in the behavior of AMS biodiesel prices relative to OPIS prices, with AMS reported prices much lower. This tendency towards lower AMS prices became especially pronounced during 2023.
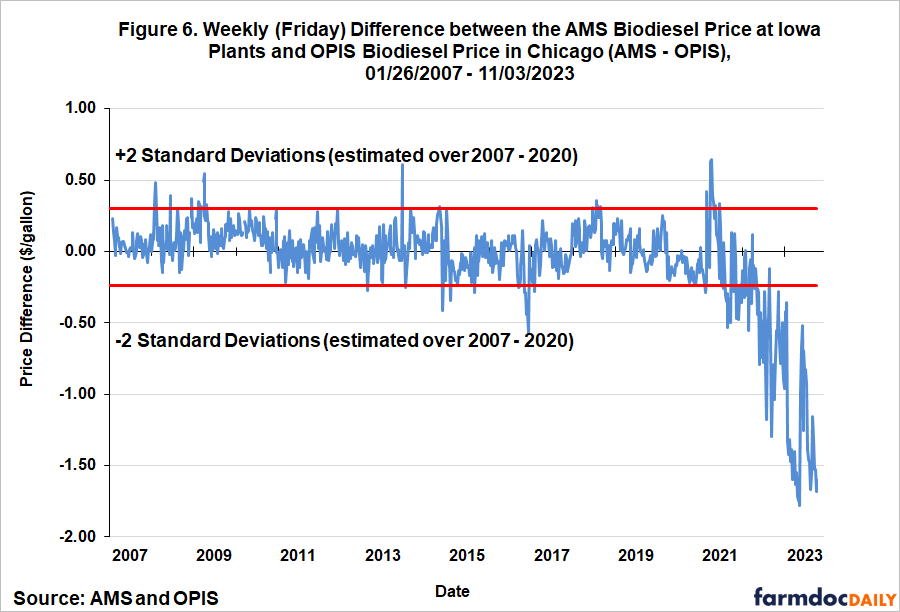
In order to home in on the change in relative price behavior, the difference between the AMS and OPIS biodiesel prices (AMS – OPIS) is shown in Figure 6. In addition to the weekly difference observations, the red lines on the chart correspond to +/- two standard deviations above and below the mean difference over 2007-2020. From this perspective, the difference between the two biodiesel prices for nearly 15 years moved in a stable range of around $0.50 per gallon centered on zero. In August 2021, the difference began to regularly go below the old lower bound. The difference has only grown since, reaching a record low of -$1.78 in early June 2023. For all of 2023, the difference between the two biodiesel prices averaged an astounding -$1.25 per gallon.
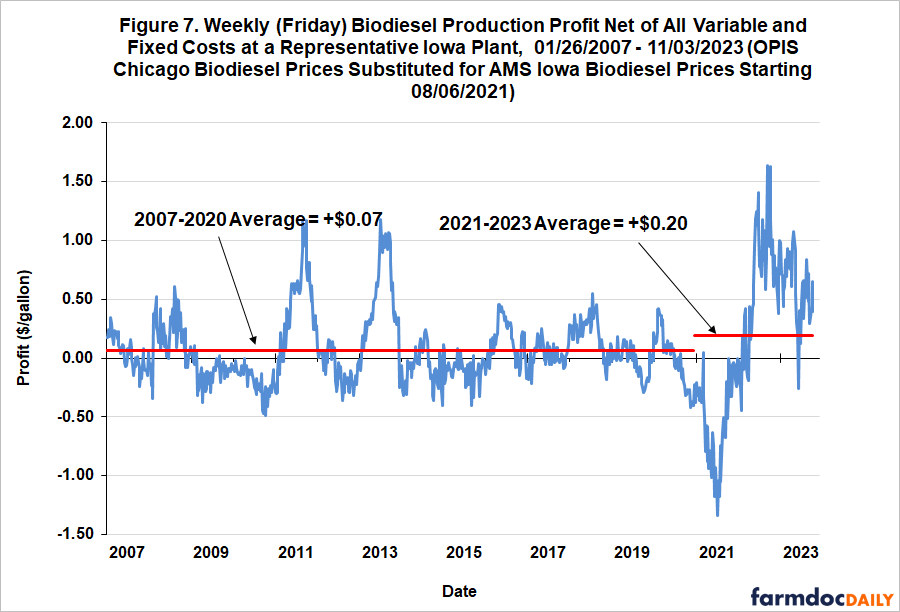
At this point it is patently clear that the behavior of the AMS biodiesel price, OPIS biodiesel price, or both changed markedly since mid-2021. In order to identify which of these scenarios is most likely, we recompute FAME biodiesel production profits substituting the OPIS Chicago prices for AMS Iowa prices starting in August 2021. The ultimate goal is to see if this results in estimates of biodiesel production profits that better match the pattern of biodiesel production shown earlier in Figures 2 and 3. Figure 7 presents the profit estimates with this substitution. It is important to emphasize that the only change from the profit estimates presented earlier in Figure 1 and here in Figure 7 is the substitution of OPIS Chicago biodiesel prices for the AMS prices. This change flips the average profitability estimate for the renewable diesel boom years (2021-2023) from -$0.37 to +$0.20 per gallon, a swing of nearly sixty cents. The average actually obscures two clearly different periods for FAME biodiesel production profits. The estimated average loss for 2021 was still record large at -$0.54, but the average profit for 2022 and 2023 to date was +$0.60, easily the most profitable period for biodiesel producers since 2007.
At this point, it is safe to conclude that biodiesel prices collected from a well-known industry source—OPIS—provide a better estimate of the price received by a representative Iowa biodiesel producer since August 2021 than AMS prices. The large profits since 2022 estimated using OPIS prices are consistent with the robust levels of FAME biodiesel production that can be seen in Figures 2 and 3. This, of course, raises the question of what caused the changed behavior of AMS Iowa biodiesel prices. We contacted the AMS staff responsible for collecting the Iowa biodiesel prices and they said that there had not been any changes to the survey instrument, or the firms surveyed for the report. To the best of their knowledge, nothing had changed regarding the survey process. The only remaining possibility is that the biodiesel firms surveyed by AMS changed the way they were reporting prices, and in an unusually dramatic fashion.
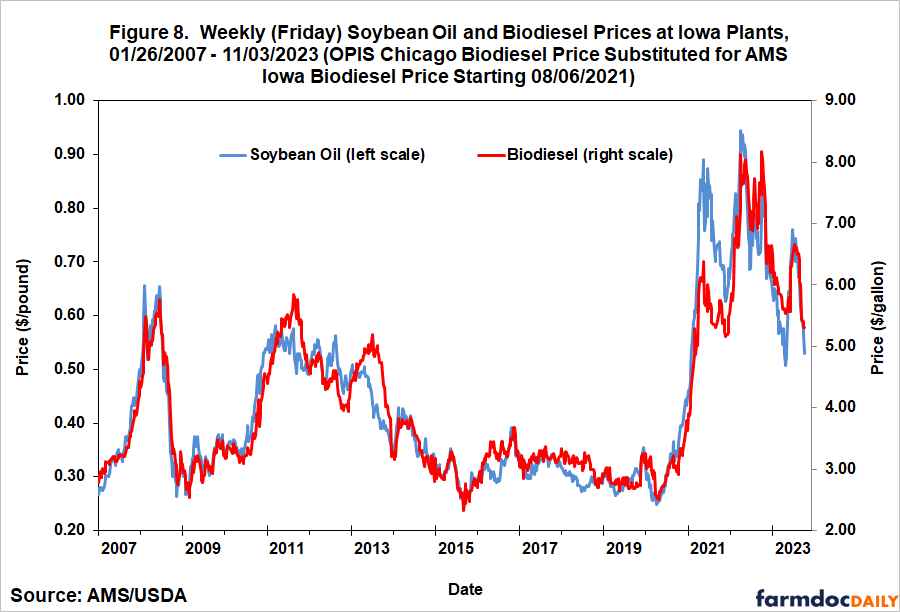
From this vantage point, we can tell a new and interesting story about the experience of U.S. FAME biodiesel producers during the renewable diesel boom. Figure 8 is helpful in this regard. It shows weekly AMS soybean oil and biodiesel prices at Iowa plants over January 26, 2007 through November 3, 2023, with the important proviso that OPIS Chicago biodiesel prices are substituted for AMS biodiesel prices starting on August 6, 2021. The impact of the renewable diesel boom on soybean oil prices was nothing short of spectacular, with prices nearly tripling in the first half of 2021. Biodiesel prices initially followed the surge upward in soybean oil prices, but lagged in the second half of 2021, which caused the large losses documented in Figure 7. In 2022 and 2023, biodiesel prices recovered substantially relative to soybean oil prices, resulting in the historically large biodiesel production profits during this period. In sum, the renewable diesel boom was responsible for squeezing FAME biodiesel production profits during the early phase of the boom, but since then biodiesel producers have enjoyed their best period of profits since 2007. While there may be other factors that also contributed to the historically large profits, such as high diesel prices, it is still impressive that this happened in the midst of the renewable diesel boom.
Implications
The renewable diesel boom in the U.S. has raised a host of interesting questions about the biofuels sector. A particularly important one is the impact of the boom on FAME biodiesel production and profits. Previous analysis (farmdoc daily, May 10, 2023) indicates that competition from renewable diesel dramatically squeezed the profitability of biodiesel production starting in 2021. However, despite the severity of the estimated losses, biodiesel production has not systematically declined during the renewable diesel boom and has been quite robust throughout 2023. Since it is highly unlikely that the production data are in error, one is left with the conclusion that something was seriously amiss with the technical assumptions or price data used in the previous article to estimate profitability.
The analysis in the present article shows that a single factor is in all likelihood responsible for the over-estimation of production losses. Specifically, the behavior of biodiesel prices reported by the Agricultural Marketing Service (AMS) of the USDA changed dramatically relative to a well-known industry benchmark price from OPIS starting in August 2021. Previous to this date, AMS and OPIS biodiesel prices differed, on average, by only a few cents and were extremely highly correlated. Beginning in August 2021, AMS prices began to lag far behind OPIS prices, with the difference reaching over $1.50 per gallon at times. If OPIS biodiesel prices are substituted for AMS prices starting in August 2021, the average biodiesel profitability estimate for the renewable diesel boom years (2021-2023) is flipped from -$0.37 to +$0.20 per gallon, a swing of nearly sixty cents. Furthermore, the estimated average profit for 2022 and 2023 to date is +$0.60 per gallon, easily the most profitable period for biodiesel producers since 2007.
In sum, the revised profitability estimates show that FAME biodiesel producers in the U.S. have weathered the renewable diesel boom that started in 2021 much better than many expected. The outlook is not entirely rosy, however. Robust FAME production, in combination with surging renewable diesel production, may lead to more D4 RINs being generated than is needed for compliance with RFS mandates. This could lead to D4 RIN prices going even further “off the cliff” than they have in recent months.
References
Gerveni, M., T. Hubbs and S. Irwin. "The Biodiesel Profitability Squeeze." farmdoc daily (13):85, Department of Agricultural and Consumer Economics, University of Illinois at Urbana-Champaign, May 10, 2023.
Gerveni, M., T. Hubbs and S. Irwin. "Biodiesel and Renewable Diesel: What’s the Difference?" farmdoc daily (13):22, Department of Agricultural and Consumer Economics, University of Illinois at Urbana-Champaign, February 8, 2023.
Irwin, S. "Biodiesel Production Profits in 2019." farmdoc daily (10):21, Department of Agricultural and Consumer Economics, University of Illinois at Urbana-Champaign, February 5, 2020.
Irwin, S. "Biodiesel Production Profits in 2020: A Real Rollercoaster Ride." farmdoc daily (11):17, Department of Agricultural and Consumer Economics, University of Illinois at Urbana-Champaign, February 3, 2021.
Irwin, S. "2021 Was a Devastating Year for Biodiesel Production Profits." farmdoc daily (12):21, Department of Agricultural and Consumer Economics, University of Illinois at Urbana-Champaign, February 16, 2022.
Disclaimer: We request all readers, electronic media and others follow our citation guidelines when re-posting articles from farmdoc daily. Guidelines are available here. The farmdoc daily website falls under University of Illinois copyright and intellectual property rights. For a detailed statement, please see the University of Illinois Copyright Information and Policies here.


