


Lessons from Marketing Crops for 25 Years
In this farmdoc daily article, I share some lessons I’ve learned from marketing crops for 25 years. My hope is that you may find them helpful in your farming operation.
Honesty and objectivity are absolutely non-negotiable when it comes to marketing. Only through objective analysis can you know if your marketing decisions are adding to your profits. A useful gauge is if your price is above the average price for your area if you’re a seller, or below the average price if you’re a buyer. An easily obtainable comparative price is the monthly and annual cash prices reported by the US Department of Agriculture, National Agricultural Statistics Service (USDA, NASS) for the US and individual states.
You need to enjoy marketing to be good at it. When you fail – and even the best marketers fail often – enjoyment is a reward that eases the negative feelings that come with failure.
- If you don’t enjoy marketing, set up a simple marketing plan that roughly gives you the average price for your area. Getting the average price for your area will keep marketing from hampering your competitiveness and will reduce stress so you can improve other skills. One often-mentioned simple marketing plan is to sell or buy 2% of production or inputs every week over a year. Also see the last section of this article.
Year-to-year consistency has benefits. Part of your marketing plan should involve pricing at roughly the same time each year. Consistency averages out random price swings, which can be large. It can also support other parts of your business. Specifically,
- Coordinate marketing with known cash flow needs to avoid desperation trades at bad prices. Common cash flow needs are payment of taxes and buying inputs at roughly the same time each year to capture routine seasonal deals and manage taxes.
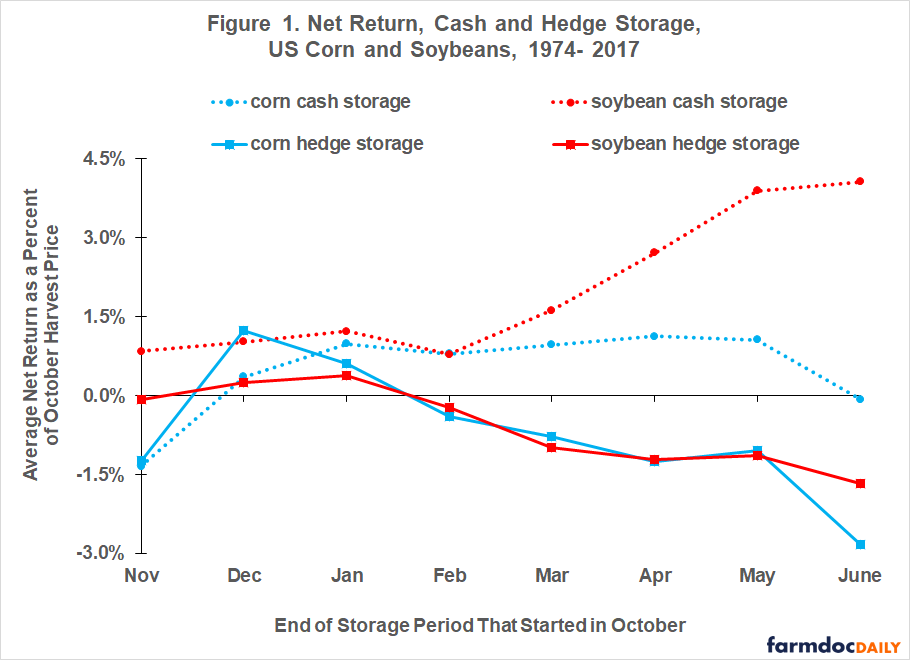
- Coordinate marketing and storage. Research finds that average returns over time to both cash storage and storage hedged with futures track storage average storage cost over time (see Figure 1, a reprint of Figure 1 in the farmdoc daily of September 9, 2020 and Zulauf and Kim, 2020). See the two articles for more in depth discussion of the data, analysis, and findings.
- While storage profit are small in general, storage can facilitate other benefits. Buyers can buy at harvest when prices are typically lowest. Crop farmers can harvest faster with less field loss. Harvest can continue if off-farm outlets are closed. When making marketing decisions on stored crops, be aware that you may react differently to the cash cost of commercial storage than to the already-paid storage cost of on-farm bins.
For the part of your marketing plan that varies each year, fight regret. Regret is powerful and focuses you on past, not current decisions. These strategies will not always be successful but they will help you fight regret.
Reward favorable price changes. If a market has moved 5% from your last trade, sell some if a seller and the move is up or buy some if a buyer and the move is down. A 5% move is enough to impact supply and demand decisions, which tend to reverse a price move. Higher prices curtail demand and stimulate supply; lower prices stimulate demand and curtail supply.
Reward big 1-day moves. Markets often overreact on big 1-day moves.
Reward a “good” price. If the market offers a good price, take advantage of it. An objective measure of a “good price” is one that brings a return that makes you happy.
NOTE, most of the preceding discussion has been previously posted as a farmdoc video.
Perspective on Performance of Simple Marketing Plans
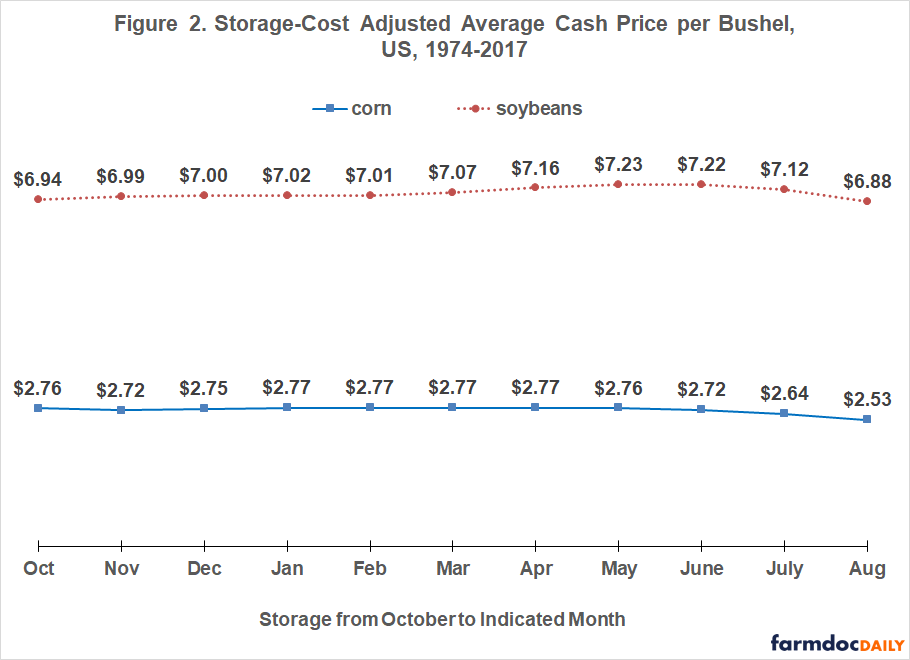
The data used for Figure 1 are recast as a storage-cost adjusted cash price for a month. Specifically, physical storage cost and interest opportunity cost for storage starting in October, such as from October to March, are subtracted from the NASS cash price reported for a month, such as March (see Data Note). This recasting of the data in essence puts all prices on an October (i.e. harvest) comparative basis.
The storage-cost adjusted average cash price of corn over the 1974-2017 crop years varied within a range of 5 cents per bushel ($2.72 to $2.77) excluding the lower average prices in July and August (see Figure 2). The range was higher for soybeans at 24 cents per bushel ($6.99 to $7.23) after excluding the lower prices in October and August.
Discussions with farmers over the years suggest that a common marketing strategy they use is to sell some at harvest, some in December or January to pay for inputs and manage taxes, some in March before the start of spring field work and higher temperatures that can cause grain to go out-of-condition, and some in June to clean out the bins and avoid the risk of storing in the higher humidity of summer. If equal amounts are sold at these four times, the average price for corn is $2.75 per bushel after removing storage costs from harvest to the selling month. In comparison, the average is $2.72 for all 11 months and $2.75 for November through June (i.e. avoid selling during harvest and after June 30). For soybeans, the averages are $7.06 for the four common sell months, $7.06 for all 11 months, and $7.09 for November through June. If nothing is sold during harvest, the average price for selling in December/January, March, and June is $2.75 for corn and $7.10 for soybeans.
The results of this simple analysis suggest that the simple, common strategy that farmers say they are using works quite nicely in getting them close to the average price over their lifetime as farmers. They also suggest to avoid selling, if possible, during harvest and after June 30, although years do exist with high prices in these periods. In other words, simple strategies can perform quite nicely at keeping you from having very low prices over a farming career and that farmers are not performing badly at marketing when viewed over their career.
Data Note
The cash price NASS reports for a month includes both grain sold during the month and grain sold earlier for delivery in that month. Thus, all corn and soybeans delivered in a month were not sold during that month. In other words, they were sold at a forward, not a cash price. The share that is forward priced is known to vary from year to year. This data feature should be kept in mind.
References and Data
US Department of Agriculture, National Agricultural Statistics Service. December 2023. Quick Stats (select specific crop, price received). http://quickstats.nass.usda.gov/
Zulauf, C. and S. Kim. “Corn vs. Soybean Storage at the US Market Level, 1974-2017.” farmdoc daily (10):163, Department of Agricultural and Consumer Economics, University of Illinois at Urbana-Champaign, September 9, 2020.
Zulauf, C. and S. Kim. 2020. US Market Net Return and Risk to Storing Corn and Soybeans, 1974-2017. Journal of the American Society of Farm Managers and Rural Appraisers. Pages 73-80. https://www.asfmra.org/resources/asfmra-journal
Disclaimer: We request all readers, electronic media and others follow our citation guidelines when re-posting articles from farmdoc daily. Guidelines are available here. The farmdoc daily website falls under University of Illinois copyright and intellectual property rights. For a detailed statement, please see the University of Illinois Copyright Information and Policies here.