


Post-harvest Grain Marketing: Store and Ignore Versus Market Responsive Farms
Like fingerprints and snowflakes, no two farms are exactly alike. This article describes one point of difference among Illinois grain farms: post-harvest grain marketing. In a previous article (farmdoc daily, December 8, 2023), I outlined the post-harvest marketing challenge. Farms must decide whether to sell their crop promptly after harvest or store it in expectation of higher prices for delivery later in the marketing year. I showed how important this sell or store decision is for the farm sector in aggregate. Roughly 60% of corn and soybeans produced in Illinois remain to be marketed at the end of the calendar year. This unmarketed production presents a price risk management challenge for the farm.
In this article, I describe differences in post-harvest marketing across farms using financial records from the Illinois Farm Business Farm Management (FBFM) Association. The “60% to be marketed” figure cited above is not the result of all farms choosing to market the same proportion of their crop. Inventory holding decisions vary widely across farms.
While farm marketing activity is heterogeneous, I do identify some regular tendencies. I characterize farms in two broad groups based on data on farm book inventories of corn and soybeans. One group of “market responsive” farms adjust inventory levels more from year to year. These farms also hold lower levels of inventory relative to production. A second group of “store and ignore” farms hold essentially all their production as book inventory at calendar year end. This group tends not to vary inventory levels much over time. They are also significantly less responsive to changing market conditions. When futures spreads indicate higher returns to storage, the market responsive group increases inventories more than the store and ignore group.
The Distribution of Farm-Level Grain Inventories
In a previous article, I described the relationship between marketing weights, the proportion of the crop marketed in a given period, and book inventory, the quantity of a commodity recorded as inventory on the farm’s financial statements which are typically as of the calendar year end. To facilitate comparisons across farms, I express inventories as a share of production since inventories are closely related to farm size and the quantity of grain produced. On December 31, book inventories are slightly larger than the proportion of the crop marketed, but the two measures move together so that variation in one is informative about the other. This is important for my analysis because there are no representative farm-level data on farm marketing weights; data on book inventories by farm, commodity, and year are available from FBFM.
I assemble data on inventory and production quantities for corn and soybeans for roughly 16,000 farm-year observations from FBFM between 2003 and 2020. In any given year, I observe 800-1000 commercial grain farms in these data. Nearly all grain farms in FBFM grow both corn and soybeans. The data allow for analysis of the same farms over time; for a given farm, there are annual records for an average of about six years. These data were also used in a recently published academic study of commodity storage and marketing (Janzen, Paulson, and Tsay, 2023) on which this article is based.
In aggregate, Illinois FBFM farms have roughly 80% of production in book inventory on December 31, but individual farms vary substantially from this aggregate level. I quantify the variation in book inventories across farms in Figure 1; it shows the distribution of book inventories as a share of production for grain farms in FBFM between 2003 and 2020. Each bar represents the share of farms in these data that hold a particular inventory level relative to the farm’s own production. One bar stands out in both panels of Figure 1. Roughly 40% of farms hold 100% of production in inventory at the end of a calendar year. These farms have no realized new-crop sales between harvest and December 31. In addition, a small group of roughly 5% of farms have more than 100% of production in book inventories. For farms in these categories, post-harvest grain marketing is more important than for the “typical” farm described by average or aggregate data.
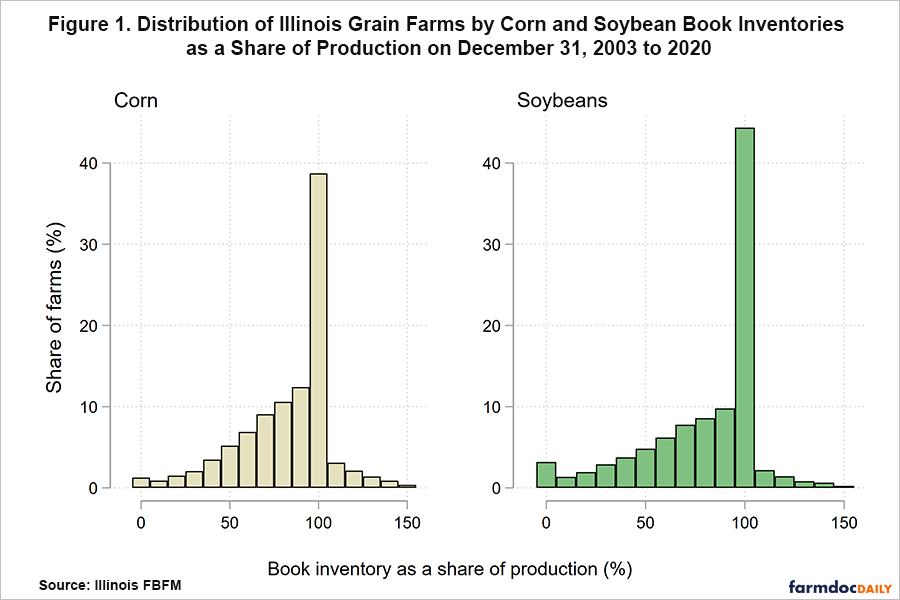
While holding large post-harvest inventories is a relatively common strategy, the majority of farms hold less than 95% of production in inventory. Figure 1 shows more farms in this group hold relatively large levels of inventory. However, there are farms who have moved all or nearly all of their production by the end of the calendar year. I interpret the range of outcomes in Figure 1 to suggest that farms employ a wide variety of marketing strategies.
How Do Farms Adjust Inventories Over Time?
The group of farms holding all of production in inventory shown as the tall vertical bars in Figure 1 is year after year comprised of many of the same farms. To show this, I calculate transition probabilities for the inventory share of production. These probabilities describe the likelihood that a farm holds a given inventory share next year, conditional on its inventory share this year. I divide farms into seven categories by inventory share with the number of farms in each bin roughly equal. I calculate transition probabilities for each possible inventory level in subsequent years.
Figure 2 plots these transition probabilities. For farms in each inventory share category (e.g., farms with between 0 and 50% of production in inventory), I determine the probability of being in each of the seven categories in the next year. The transition probabilities for each category, given in each row of the grid shown in Figure 2, must add up to 100%.
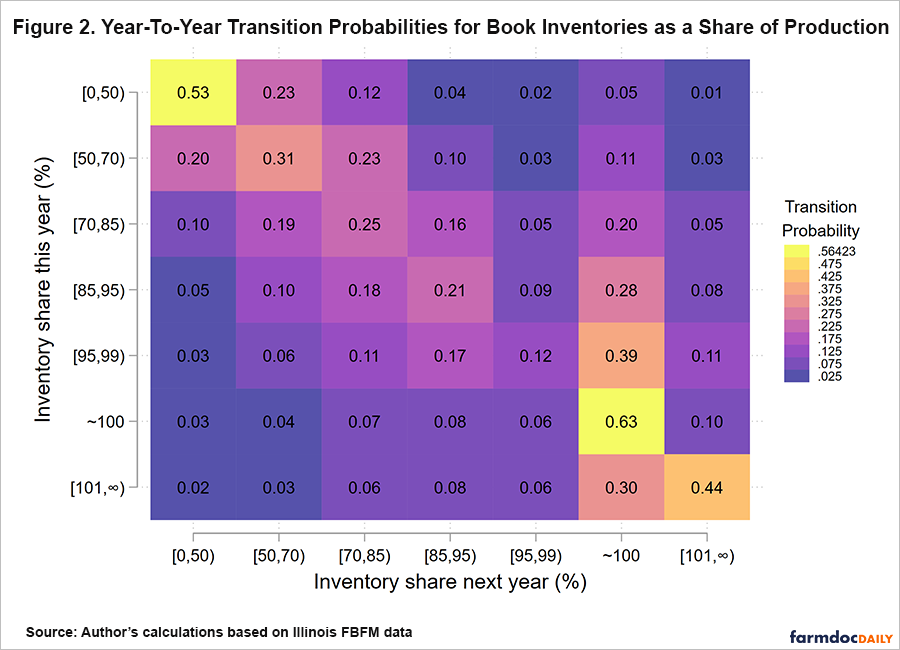
Figure 2 shows that farms tend to hold inventory at similar levels over time, but this tendency for stasis is much stronger for farms in the high inventory categories. The bottom right corner of the grid shows farms with approximately 100% of production in inventory have a 63% probability of holding the same inventory level next year. Farms with lower inventory levels are more likely to move more between inventory share categories over time.
Implications
I find there is a large group of Illinois grain farms that has book inventories equal or greater than calendar year production on December 31, shortly following harvest. These farms tend to be the same ones year after year. Book inventories are negatively related to marketing activity, suggesting farms with large inventories as a share to production retain substantial price risk after harvest. For this reason, I term these “store and ignore” farms: they hold large inventories and ignore opportunities to price grain until well after harvest. A slightly larger group of farms actively adjusts storage and marketing activity over time. I call these farms “market responsive”. They are more active marketers, and their inventory changes are more strongly correlated with market signals to hold inventory. I measure the correlation between the futures calendar spread between nearby and deferred futures prices, a widely followed measure of the returns to storage, and the inventory share. I find this correlation is positive for both groups – all farmers store more when the market signals it is profitable to do so – but the correlation is significantly stronger for the market responsive group.
While the store and ignore strategy appears to be a risky one, this analysis does not assess whether holding large inventories after harvest is more profitable. This analysis of farmer post-harvest grain marketing activity is based on inventory quantities alone. In forthcoming articles, I will use farm financial records to examine the economic benefits and costs of post-harvest grain marketing and storage and shed light on why farm marketing behavior varies so much across farms.
Acknowledgment
The author would like to acknowledge that data used in this study comes from the Illinois Farm Business Farm Management (FBFM) Association. Without Illinois FBFM, information as comprehensive and accurate as this would not be available for educational purposes. FBFM, which consists of 5,000+ farmers and 70 professional field staff, is a not-for-profit organization available to all farm operators in Illinois. FBFM field staff provide on-farm counsel along with recordkeeping, farm financial management, business entity planning and income tax management. For more information, please contact the FBFM office located on the campus of the University of Illinois in the Department of Agricultural and Consumer Economics at 217-333-8346 or visit the FBFM website at www.fbfm.org.
References
Janzen, J. "Post-Harvest Grain Marketing: How Important Is It?" farmdoc daily (13):223, Department of Agricultural and Consumer Economics, University of Illinois at Urbana-Champaign, December 8, 2023.
Janzen, J.P., N.D. Paulson, and J. Tsay. 2023. “Commodity storage and the cost of capital: Evidence from Illinois grain farms.” American Journal of Agricultural Economics, https://doi.org/10.1111/ajae.12436
Disclaimer: We request all readers, electronic media and others follow our citation guidelines when re-posting articles from farmdoc daily. Guidelines are available here. The farmdoc daily website falls under University of Illinois copyright and intellectual property rights. For a detailed statement, please see the University of Illinois Copyright Information and Policies here.