


Understanding Farmland REITs: An Updated Price Analysis
Note: This article was written by University of Illinois Agricultural and Consumer Economics Ph.D. student Shujie Wu and edited by Joe Janzen. It is one of several excellent articles written by graduate students in Prof. Janzen’s ACE 527 class in advanced agricultural price analysis this fall.
About a decade ago, publicly traded farmland real estate investment trusts (REITs) emerged as an investable asset. A farmland REIT acquires and manages a portfolio of farmland for the benefit of its investors. REITs generate revenue from rental income, farmland operation, and land value appreciation. Shareholders in farmland REITs benefit from both dividends paid to shareholders and from increases in the REIT share price. In this article, we focus on the latter. We identify factors affecting farmland REIT share prices, updating an earlier analysis by Peterson and Kuethe (farmdoc daily, October 28, 2015).
Farmland REITs may be an attractive investment when the current and expected profitability of production agriculture is high, so that profits are capitalized into land values (farmdoc daily, August 7, 2023). This usually occurs during periods of high commodity prices. REIT valuation also depends on the REIT return correlation with other markets and the value of holding farmland in a portfolio of other assets for diversification or as a hedge against inflation (e.g., Baral and Mei 2023). Finally, REIT prices depend not only on current factors but expectations about the future. If the profitability and risk associated with farming is expected to change in the long-run, due to changes in food, fiber, and fuel demand or because of climate-related production issues, these expectations may affect current prices. We measure the correlation between REIT share prices observed in the past decade and these factors. Understanding these relationships is important for REIT investors and others interested in farmland as a financial investment.
Where do REITs own land?
Currently, two farmland REITs are actively traded on US exchanges: Farmland Partners (NYSE ticker: FPI) and Gladstone Land (NASDAQ ticker: LAND). Both REITs own land in multiple states, but the geographic concentration of their holdings differs. Figure 1 shows the distribution of REIT farmland holdings across states. FPI’s holdings are concentrated in the Midwest US, where corn, soybeans, and wheat are the primary crops, but it also owns land in California and throughout the southeast US. FPI’s farmland portfolio became more geographically diverse when it acquired another farmland REIT, American Farmland Company, in 2017 (see PR Newswire, February 2, 2017).
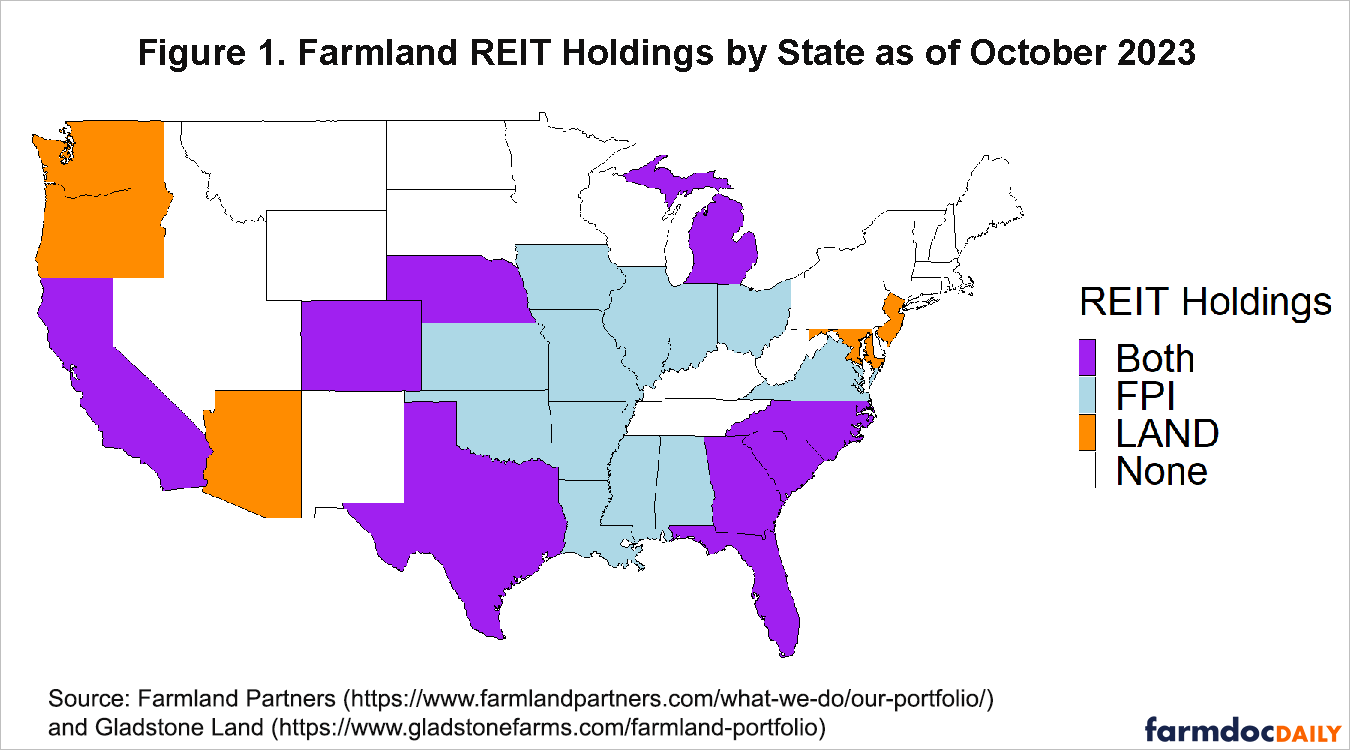
The second publicly traded farmland REIT, Gladstone, has a comparatively greater presence in California and other coastal states and relatively smaller holdings in the Midwest. Its portfolio is relatively more concentrated in land producing tree nuts, winegrapes, and other fruits and vegetables. This diversification highlights the geographical spread and crop variety within the portfolios of these farmland REITs, which may affect their resilience in the face of production risks.
What has happened to REIT prices over time?
Figure 2 shows the monthly prices of FPI and Gladstone since each began trading publicly. Share prices for both REITs declined modestly during the period from 2013 to 2016. Peterson and Kuethe (2015) discussed these price declines. Between 2016 and 2020, FPI’s share price decreased by half, while Gladstone’s price remained comparatively stable. Prices for both FPI and Gladstone increased rapidly in late 2020 and 2021. FPI’s share price nearly doubled between late 2020 and mid-2022 and has remained high relative to its historic range. Gladstone’s price also increased from roughly $15 per share to over $35 per share in mid-2022 but has since fallen back to its prior level.
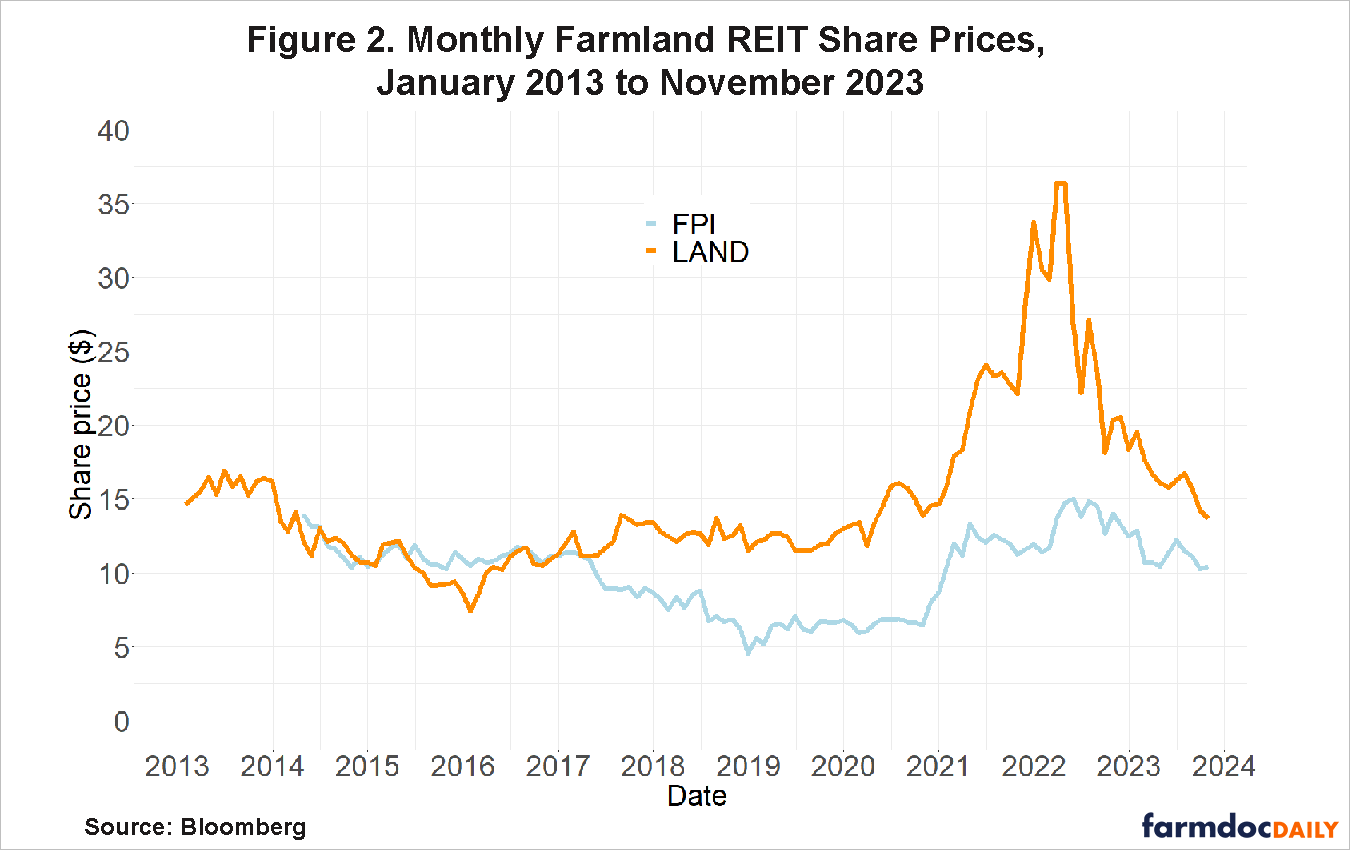
Despite large returns observed over short time periods, the returns to holding farmland REITs have been limited in the long run. Current prices for both REITs are near the levels observed at inception, though US farmland prices have appreciated significantly since 2013.
Increasing farmland REIT share prices between 2020 and 2022 coincide with a period of relative profitability for US agriculture. Net farm income nationally was high in 2021 and 2022 (farmdoc daily, November 4, 2022 ). The FPI price history shown in Figure 2 bears a striking resemblance to concurrent corn, soybean, and wheat prices. Relative to Gladstone, FPIs farmland portfolio is comparatively concentrated in corn, soybean, and wheat producing areas. This points to a short-run link between farmland REIT prices and the value of products grown on the land.
Identifying REIT price drivers
Peterson and Kuethe identified farmland rental rates as, in theory, the major driver of REIT prices, since expected future rental rates represent expected future returns to owning land. Peterson and Kuethe found that farmland REIT prices fell in the first few years of trading. Because observed farmland rental rates did not decrease over the same period, they attributed this decline to revisions in investor expectations about future returns. Assessing correlation between REIT prices and rental rates is difficult because rental rates and farmland values are typically reported annually. The correlation between the REIT prices shown in Figure 2 and past rental rates would be based on only 10 or 11 observations.
To understand what is driving REIT prices at higher frequency, we consider two important short-run measures that may drive investor decisions to buy or sell farmland REITs: farm product prices and equity index values. These factors may help us understand the imperfect relationship between REIT prices and slow-moving measures of farmland value.
Farm Product Prices
Both FPI and Gladstone operate their farmland properties with the goal of generating profit from agricultural production. Consequently, the financial performance of these REITs should be tied to agricultural markets, as changes in prices for crops cultivated on their properties affect farming revenue. Investors may base their assessment of expected future returns on current agricultural commodity prices.
Different agricultural prices may be relevant to each REIT due to differences in the geographic concentration of landholdings. For FPI, row crops like corn and soybeans are a primary focus of its farmland portfolio. We use the S&P GSCI Agriculture index as a benchmark for agricultural commodity prices since it places comparatively large weight on corn, soybeans, wheat, and other row crops. Both REITs also have farmland holdings in regions where fruits, vegetables, and tree nuts are primary crops, so these prices rather than commodity row crops may be more relevant for the REIT price. Identifying representative crops with consistent high frequency price reporting is difficult. Due to limited data availability, we use the monthly Consumer Price Index for fresh fruits and vegetables as a proxy for general fruit and vegetable prices.
Equity Indices
REIT prices may be affected by investor sentiment or financial frictions related to the equity markets where they are traded. FPI is publicly traded on the New York Stock Exchange (NYSE) and Gladstone is traded on NASDAQ. We consider the NYSE Composite Index and the NASDAQ Composite Index as measures of the equity index factor for each REIT.
Climate change
Peterson and Kuethe suggested long-run expectations may be as relevant to farmland markets as the short-run factors suggested above. Climate change is one major long-run factor whose impacts on US agriculture and farmland are subject to considerable debate. In addition to the factors above, we explore the relationship between climate change concerns and investor valuation in the farmland market. We consider correlation between farmland REIT prices and the Wall Street Journal Climate Change Index (WSJCCI) introduced by Engle et al. (2020). The WSJCCI uses sentiment analysis on climate change-related news articles from the Wall Street Journal to assess public sentiment about the issue of climate change and how it changes at monthly frequency. Higher values for this index are associated with negative public sentiment and greater concern, but the relationship between sentiment and farmland values may be positive or negative.
Results
We assess the correlation between farmland REIT prices and the factors we identify above: farm product prices, equity index values, and climate change, using a Fama-French-style factor regression analysis. Briefly, this method measures the relationship between month-to-month percentage price changes for each REIT and the contemporaneous percentage changes in the factors. Price changes are also referred to as returns since they represent the return to holding the asset from one period to the next. We present two versions of the results: one for our entire time period from the time each REIT started trading to the present and one for a shorter time period, 2013-2018, where we have data on the WSJCCI.
For the full 2013-2023 analysis (detailed results in Table A1), we find a positive correlation between farmland REIT returns and equity index returns for both FPI and Gladstone. This implies REIT returns may provide only limited portfolio diversification benefits for investors. We also find a significant, but smaller correlation between FPI and the GSCI index of agricultural commodity prices. There is not a significant relationship between Gladstone and this index. Returns for both REITs do not have significant correlations with fruit and vegetable returns. This confirms to some degree the idea that the geographic concentration of farmland holdings may drive returns as the REIT with a larger presence in corn, soybean, and wheat producing areas, FPI, is more closely related to prices of those commodities. However, the connection between commodity prices and farmland REIT prices is not particularly strong.
We modify our analysis to consider the impact of high frequency climate change sentiment (detailed results in Table A2). This additional analysis only covers 2013-2018 due to the limited availability of WSJCCI data. Overall, the REITs prices show negative correlations with WSJCCI. As high WSJCCI values mean negative public sentiment and implies pessimism about climate change, the regression analysis suggests that the farmland REITs prices are fall when the public is more concerned about climate change. This could be due to investors’ negative expectations about agricultural productivity or actual physical damage to agricultural production given climate-related weather events. The specific mechanism is beyond the scope of this analysis. However, the relationship we find is not statistically significant. Further examinations of climate change sentiment and farmland values is necessary.
Conclusion
Share prices for publicly traded farmland REITs have varied substantially in their relatively short lifetime, but overall, the returns to owning farmland REITs in this eleven year history are limited. REIT values are stagnant in the long run. Investor interest in farmland REITs may be concentrated among those who prioritize consistent dividend income streams rather than share price appreciation.
Short-run share price fluctuations depend on factors that include commodity prices and stock market returns. The FPI price appears to be more closely correlated to corn and soybean prices compared to Gladstone. Both REITs are correlated with returns on the stock exchanges on which they are listed, suggesting the portfolio diversification benefits of investing in farmland REITs may be limited. In the short term, sentiment about climate change has a negative association with the performance of these REITs, but this relationship is not statistically significant. The long-term effect of climate expectations on farmland markets requires further careful examination and measurement. Overall, our findings underscore the complexity of factors influencing the pricing dynamics of farmland REITs and emphasize the need for careful consideration of multiple variables in investment analysis.
References
Baral, S., and Mei, B. (2023). Inflation hedging effectiveness of farmland and timberland assets in the United States. Forest Policy and Economics, Volume 151 https://doi.org/10.1016/j.forpol.2023.102969
Engle, R. F., Giglio, S., Kelly, B., Lee, H., & Stroebel, J. (2020). Hedging climate change news. The Review of Financial Studies, 33(3), 1184-1216. https://doi.org/10.1093/rfs/hhz072
Farmland Partners Inc., corporate website. http://www.farmlandpartners.com/
Gladstone Land Corporation, corporate website. http://ir.gladstoneland.com/index.cfm
Langemeier, M. "U.S. Farm Sector Financial Performance." farmdoc daily (12):166, Department of Agricultural and Consumer Economics, University of Illinois at Urbana-Champaign, November 4, 2022.
Peterson, P. and T. Kuethe. "Understanding Farmland REITs." farmdoc daily (5):200, Department of Agricultural and Consumer Economics, University of Illinois at Urbana-Champaign, October 28, 2015.
Zwilling, B. "Illinois Farm Real Estate Values Continues Increase per Acre for 2023 at 4.5%." farmdoc daily (13):145, Department of Agricultural and Consumer Economics, University of Illinois at Urbana-Champaign, August 7, 2023.
Appendices
Table A1. Estimated Coefficients for Monthly Two-Factor Regressions Using Data to 2023 |
||
| FPI | LAND | |
| GSCI Index | 0.311* | 0.119 |
| F&V CPI Index | -0.969 | -1.006 |
| Equity Index | 0.608*** | 0.778*** |
Note: This table represents the regression results without climate change index, from 2014 (2013) to 2023 for FPI (LAND). The stock index differs for FPI (NYSE) and LAND (NASDAQ). All data are retrieved from Bloomberg. * indicates statistical significance at the 5% level and *** indicates statistical significance at the 0.1% level.
Table A2. Estimated Coefficients for Monthly Three-Factor Regressions Using Data for 2013-2018 |
||
| FPI | LAND | |
| GSCI Index | 0.193 | -0.005 |
| F&V CPI Index | -0.878 | -2.022 |
| Equity Index | 0.125 | 0.457 |
| Climate Index | -2.757 | -7.832 |
Note: This table represents the regression results with climate change index, from 2014 (2013) to 2018 for FPI (LAND). The stock index differs for FPI (NYSE) and LAND (NASDAQ). The climate change index is retrieved from https://sites.google.com/view/stefanogiglio/
Disclaimer: We request all readers, electronic media and others follow our citation guidelines when re-posting articles from farmdoc daily. Guidelines are available here. The farmdoc daily website falls under University of Illinois copyright and intellectual property rights. For a detailed statement, please see the University of Illinois Copyright Information and Policies here.