Working Capital Trends for Illinois Farms: A Regional Comparison from 2003-2022
This article examines the trends of annual working capital of farms in Illinois, using data from the Illinois Farm Business Farm Management (FBFM). Working capital is a measure of financial liquidity and is defined as the difference between current assets and current liabilities. We report the trends in the lower quartile, median, and upper quartile working capital of farms in Illinois statewide and across three regions—Central, Northern, and Southern Illinois—over a twenty-year period from 2003 to 2022.
Quartiles divide sorted data into four groups, each containing an equal number of values. In the context of working capital, the first quartile (lower quartile) represents the value below which 25% of the working capital values fall. This indicates that 25% of farms have a working capital lower than this value. The second quartile is the median of the dataset, meaning that 50% of the working capital values fall below this point. This represents the middle value of working capital for all farms. Lastly, the third quartile (upper quartile) is the value below which 75% of the working capital values fall. This means that 75% of farms have a working capital less than this value.
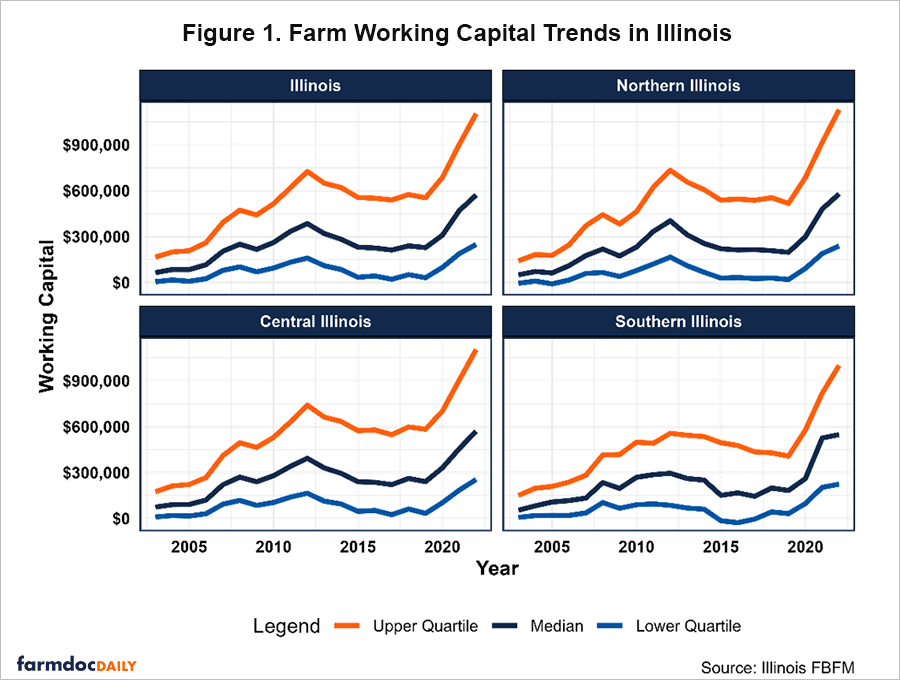
Overall, Illinois farms substantially increased their working capital from 2003 to 2022, as shown in Figure 1. Statewide, the lower quartile farms raised their working capital from $4,826 in 2003 to $248,473 by 2022, an over fifty-fold increase. This indicates that the bottom 25th percentile of farms significantly improved their liquidity over the twenty-year period. The median Illinois farm experienced a nine-fold increase in working capital from $64,131 to $571,220 during this period, while the upper quartile rose from $165,562 to over $1.1 million.
The working capital trends for all regions closely follow the accrual net farm income trend. Incomes gradually increased from 2003 to 2006 and then increased more sharply from 2007 to 2013, with high commodity prices linked to increased corn demand for ethanol, and export market growth for soybeans. The widespread drought in 2012 could have resulted in negative shocks to incomes and liquidity positions, but crop insurance and higher prices helped to buffer those impacts. Incomes were decreasing with lower crop prices and higher costs from 2013 until 2019. Then incomes rose from 2020 until 2022, with 2022 being the highest income year ever.
In Central Illinois, farms maintained the highest working capital of any region in most years. This region, primarily comprised of grain farms, also has had the highest income over this time. The lower quartile increased from $9,891 in 2003 to $254,902 in 2022. Over the same period, the median rose from $74,587 to $570,469, while the upper quartile increased from $174,806 to $1,104,286.
In Northern Illinois, the lower quartile increased from -$5,647 in 2003 to $238,574 in 2022. The median increased from $49,794 in 2003 to $578,936 in 2022, while the upper quartile working capital increased from $141,379 to a value of $1,129,314 in this period, the highest amongst all regions. Northern Illinois on average plants a larger percentage of their acres to corn and there are more livestock farms in this region as well.
Southern Illinois had lower working capital levels compared to Northern and Central Illinois in most years. The lower quartile rose from $7,024 in 2003 to $224,518 in 2022. The median working capital increased from $54,165 to $548,296 over the same period, while the upper quartile working capital increased from $150,331 to $1,000,725. Southern Illinois has lower and more variable soil types that lead to larger swings in net incomes. In addition, their average crop rotation differs from that of the rest of the state with more wheat followed by double crop soybeans. This leads to less corn as a percentage of all crops than the other regions.
In summary, Illinois farms substantially improved their working capital over the past twenty years, with the strongest gains occurring in Central and Northern Illinois. While Southern Illinois farms lagged in most quartile values, they still experienced a substantial improvement in liquidity over the same period.
Acknowledgment
The authors would like to acknowledge that data used in this study comes from the Illinois Farm Business Farm Management (FBFM) Association. Without Illinois FBFM, information as comprehensive and accurate as this would not be available for educational purposes. FBFM, which consists of 5,000+ farmers and 70 professional field staff, is a not-for-profit organization available to all farm operators in Illinois. FBFM field staff provide on-farm counsel along with recordkeeping, farm financial management, business entity planning and income tax management. For more information, please contact our office located on the campus of the University of Illinois in the Department of Agricultural and Consumer Economics at 217-333-8346 or visit the FBFM website at www.fbfm.org.
Disclaimer: We request all readers, electronic media and others follow our citation guidelines when re-posting articles from farmdoc daily. Guidelines are available here. The farmdoc daily website falls under University of Illinois copyright and intellectual property rights. For a detailed statement, please see the University of Illinois Copyright Information and Policies here.


