


The US Retirement Safety Net
Fiscal integrity of Social Security and Medicare, cornerstones of the US Retirement Safety Net, is a current policy concern. Since they account for 34% of Federal spending, it also seems likely that the Federal debt issue cannot be resolved without addressing their fiscal integrity. This article focuses on the interface between the US Retirement Safety Net and life expectancy. Continuing increases in life expectancy makes it likely that both programs’ eligibility age will have to be raised. Applying the relationship imbedded in the 1983 law that gradually increased Social Security’s full benefit retirement age from 65 to 67 implies a further increase in Social Security’s full benefit retirement age to 68.4 and an increase in Medicare’s eligibility age from 65 to 67. The resolution of the fiscal integrity issue for the US Retirement Safety Net will impact the Federal budget and thus potentially future farm bills and is of importance to many farm households (see Data Note).
Overview
Sources for the information in this section are the most recent Congressional Research Service reports of May 2020 for Medicare and October 2023 for Social Security.
Congress created Social Security in 1935. It pays monthly cash benefits to retired or disabled workers and their family members, and to family members of deceased workers. Eligibility for retirement benefits is age 62, subject to a permanent reduction for early retirement. Unreduced benefits are payable at the full retirement age (FRA), which is 67 for persons born in 1960 or later. Over its 88 years, Social Security has collected $26.4 trillion and paid out $23.6 trillion, leaving accumulated asset reserves of $2.8 trillion in its two trust funds at the end of 2022. Primary source of funding is a 6.2% tax that employers and employees each pay on taxable earnings, up to an annual limit of $160,200 in 2023. Other sources of funds are interest earned on the trust funds’ assets, which are held in US Treasury securities, and federal income taxes that some beneficiaries pay on part of their benefits. Using their intermediate set of assumptions, Social Security’s Board of Trustees projects currently scheduled benefits can be paid in full until 2034. Then, 70% to 80% of projected benefits can be paid.
Congress created Medicare in 1965. It pays for covered health care services of qualified beneficiaries aged 65 and older. In 1972 it was expanded to include permanently disabled individuals younger than 65. A Hospital Insurance trust fund finances hospital insurance, also called Part A. A Supplementary Medical Insurance trust fund finances medical insurance (i.e. Part B) and prescription drug coverage (i.e. Part D). Both trust funds finance Medicare Advantage (i.e. Part C) since it bundles Parts A and B. Primary source of funds for Hospital Insurance is a payroll tax paid by employees and employers. Each pays a tax of 1.45%. High-income workers pay an additional tax of 0.9%. No limit exists on taxable earnings. Although designed to be self-supporting, Hospital Insurance has faced projected shortfalls since its inception. Numerous legislative changes have postponed Insolvency. Insolvency is currently expected in 2026. Supplementary Medical Insurance was not designed to be entirely supported by dedicated income sources. Premiums cover less than one-third of Part B spending and roughly one-quarter of Part D spending. Annual contributions come from the Federal budget. They are considered mandatory spending and thus are not subject to annual appropriations.
Spending Trends
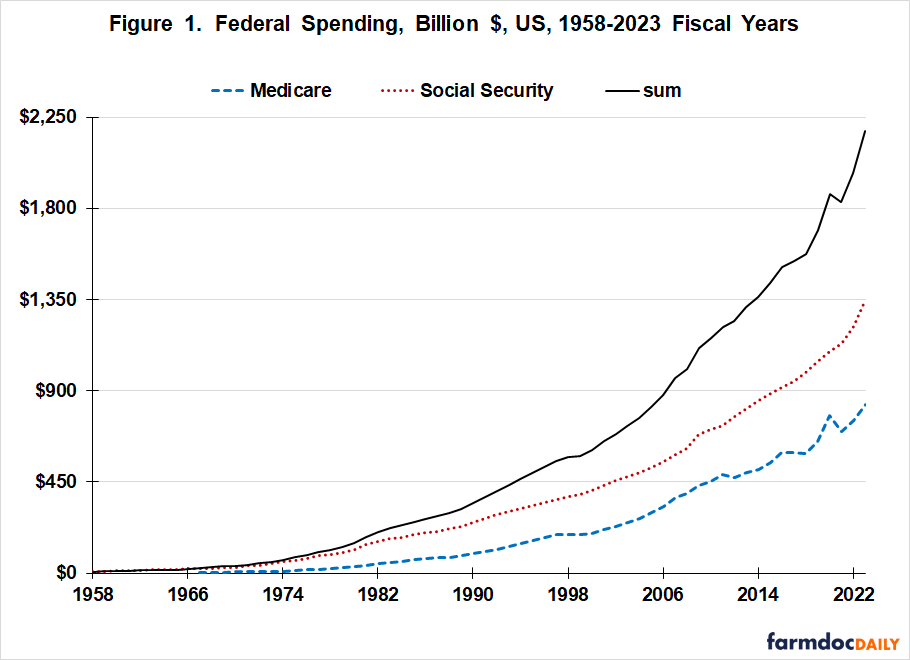
Using data from the most recent Economic Report of the President, not only has annual spending on the US Retirement Safety Net increased but the annual increase in spending also has increased over time (see Figure 1). Estimated spending for Fiscal Year 2023 is $2.2 trillion, with Social Security accounting for 62%. Over the last 10 Fiscal Years, spending has increased by 62% for Medicare and 59% for Social Security.
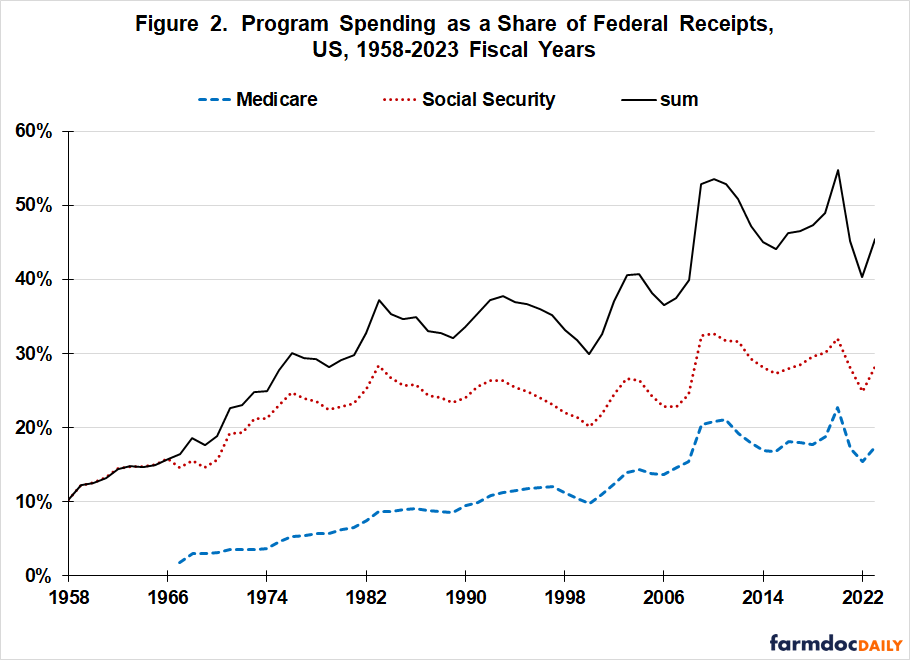
While more common to discuss expenditures, it is important to discuss receipts since Social Security and Medicare have dedicated income sources. The Economic Report of the President has a Federal receipt category, Social Insurance and Retirement Receipts. It is approximately 35% of all Federal receipts. Its share has been relatively stable since the mid-1980s. Spending for the US Retirement Safety Net currently equals 47% of all Federal receipts, up from 13% in 1960 and 30% in 2000 (see Figure 2). Raising dedicated revenue sources for Social Security or Medicare is probably not independent of discussions to raise other sources of Federal revenue.
Life Expectancy
Social Security reports two methods for calculating life expectancy (see Bell and Miller, 2023). One, referred to as period life expectancy, is life expectancy based on the death rates experienced by each age group for a specific year. The second, cohort life expectancy, is based on death rates that people born in the same year have experienced or are expected to experience over their lifetime. Cohort life expectancy tends to vary less from year to year. Sudden, temporary events, such as a flu epidemic, affect the entire population for one or two years, but affect each cohort for only one or two years of their entire lifetime. Cohort life expectancy is commonly used when analyzing gradual generational trends in mortality.
Cohort Life Expectancy at Birth
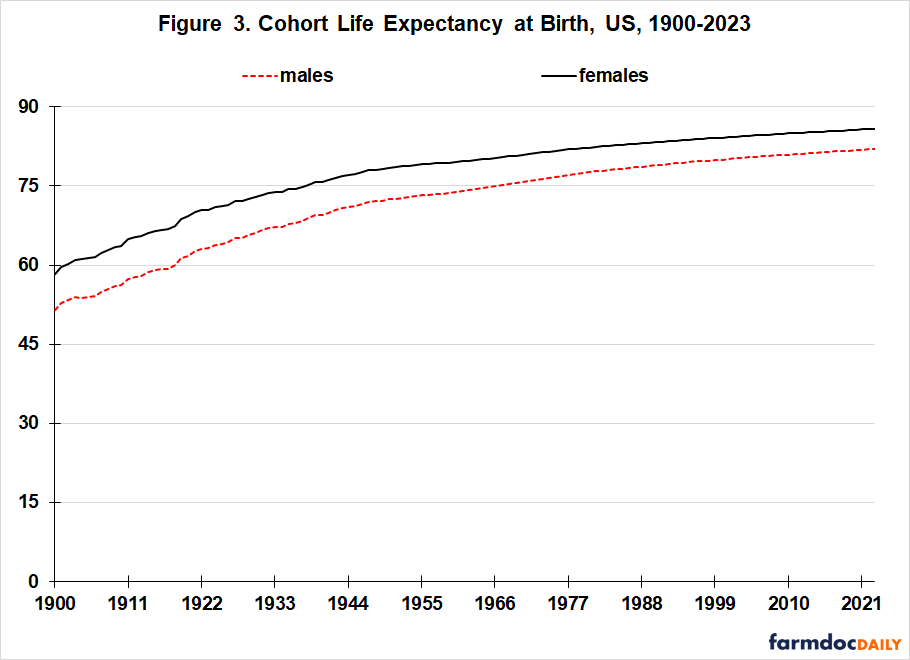
For US females and males, cohort life expectancy at birth has progressively increased since 1900 (see Figure 3). The annual increase has, however, gradually slowed since the 1920s. The female-male gap has also gradually shrunk since the 1920s. For females and males born in 2023, cohort life expectancy is, respectively, 85.8 and 82.0. For females and males born in 1900, cohort life expectancy was 58.3 and 51.5, respectively.
Cohort Life Expectancy at 65
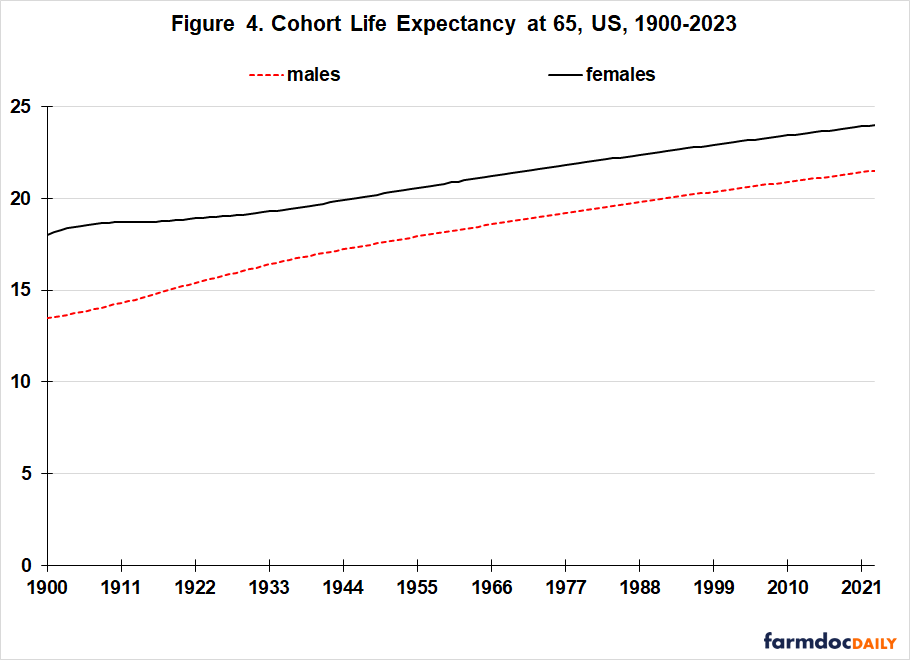
Age 65 has both historical and contemporary importance in the design of the US Retirement Safety Net. US cohort life expectancy at 65 has also progressively increased since 1900 (see Figure 4). The annual increases began slowing for males in the 1920s and began slowing very gradually for females in the 1950s. Over the last 25 years, annual increase has averaged +0.048 years for males and +0.045 years for females. For females and males born in 2023, cohort life expectancy at age 65 is expected to be 24.0 and 21.5 years, respectively. For females and males born in 1900, life expectancy at 65 was 18.0 and 13.5, respectively.
Life Expectancy at 65 and US Retirement Safety Net
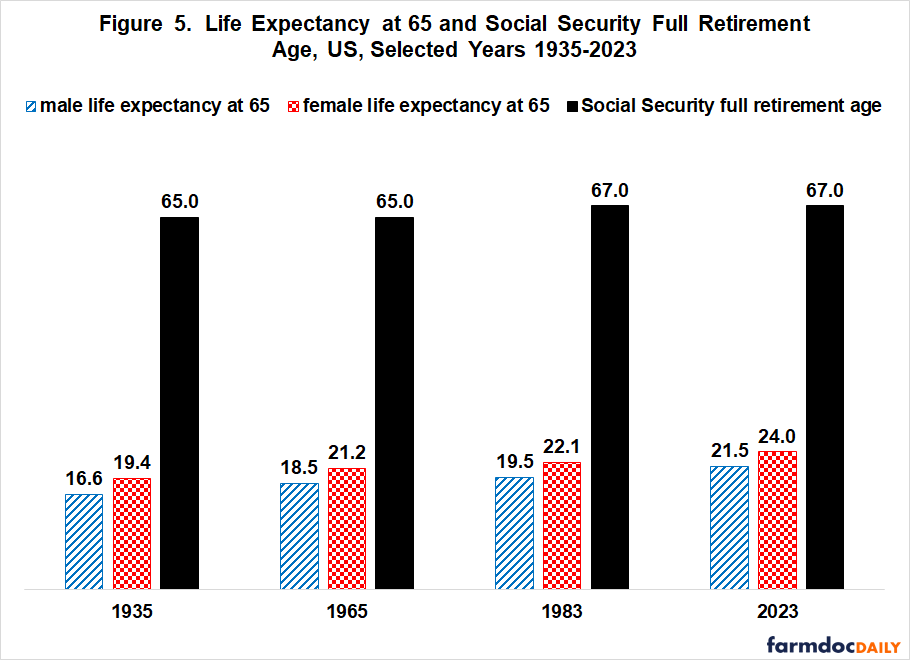
The 1983 increase in Social Security FRA from 65 to 67 was an important component of addressing its fiscal integrity at that time. The 2 year increase in FRA was roughly 70% of the 2.7 and 2.9 year increase in female and male life expectancy, respectively, between 1935 when Social Security was created and 1983 (see Figure 5). This relationship can be thought of as a US societal agreement to increase the retired lifetime of US citizens at the rate of 30% of the increase in life expectancy at 65. Applying the 1983 compromise to today’s fiscal integrity issue implies raising Social Security’s FRA to 68.4. The 1.4 year increase equals (70% times the 1.95 year average increase in female and male life expectancy at 65 from 1983 to 2023).
Applying the same approach to Medicare would increase its eligibility age from 65 to 67. The 2 year increase equals (70% times the 2.9 year average increase in female and male life expectancy at 65 from 1965 to 2023).
Discussion
Among the changes made to the Social Security program in 1983, the US chose to gradually raise the age at which full Social Security retirement benefits could be received. The 2 year increase was 70% of the increase in life expectancy that had occurred since Social Security was created in 1935.
It is unlikely the same political trade-offs will be made today as in 1983, but careful thought went into the 1983 compromise and many of the same considerations exist today. The 1983 compromise is thus a reasonable starting point for today’s policy response.
Applying the 70% factor to today’s concern with the fiscal integrity of the US Retirement Safety Net would increase Social Security’s full benefit retirement age from 67 to 68.4 and Medicare’s eligibility age from 65 to 67.
More broadly, this examination suggests that Social Security and Medicare should be discussed jointly to create an integrated US Retirement Safety Net.
It also suggests that the fiscal integrity of the US Retirement Safety Net could be enhanced by making the benefit eligibility age a moving function of increases in life expectancy instead of being a fixed age.
This article does not address a variety of related policy issues, including “What share of the fiscal integrity issue should be resolved by raising the benefit eligibility age as opposed to other benefit and funding adjustments, such as a higher cap on wages subject to the Social Security tax?”; “Is the current US Retirement Safety Net adequate?”; “What share of Federal receipts and outlays should be devoted to this Safety Net?”; “Should more of Medicare funding come from dedicated revenue sources”; and “Should Social Security and Medicare have the same full benefit retirement age?”
Data Note
While not the focus of this article, Social Security and Medicare are important to the fiscal well-being of many US farm households. According to the 2017 Census of Agriculture, 34% of farm operators were age 65 and older. According to USDA, ERS (US Department of Agriculture, Economic Research Service) data (November 30, 2023), 20% of non-farm income of farm households in 2022 were transfer payments, such as Social Security. On average, non-farm income makes up roughly 80% of farm household income (USDA, ERS, January 6, 2024).
References and Data Sources
Bell, F. C. and M. L. Miller. December 24, 2023. Life Tables for the United States Social Security Area 1900-2100. Social Security Actuarial Study No. 120. https://www.ssa.gov/oact/NOTES/as120/LifeTables_Body.html
Congressional Research Service. Updated May 21, 2020. In Focus. Medicare Overview. https://crsreports.congress.gov/product/pdf/IF/IF10885
Congressional Research Service. Updated October 2, 2023. In Focus. Social Security Overview. https://crsreports.congress.gov/product/pdf/IF/IF10426
Congressional Research Service. Updated May 21, 2020. Medicare Primer. CRS Report R40425. https://sgp.fas.org/crs/misc/R40425.pdf
Congressional Research Service. Updated October 2, 2023. Social Security Primer. CRS Report R42035. https://crsreports.congress.gov/product/pdf/R/R42035
US Department of Agriculture, National Agricultural Statistics Service. April 2019. 2017 Census of Agriculture: United States Summary and State Data. Volume 1, Geographic Area Series, Part 51. AC-17-A-51. www.agcensus.usda.gov
US Department of Agriculture, Economic Research Service. Accessed January 6, 2024. Farm Household Income and Characteristics: Principal farm operator household finances, 2018–23F. https://www.ers.usda.gov/data-products/farm-household-income-and-characteristics/
US Department of Agriculture, Economic Research Service. November 30, 2023. Farm Household Well-being: Income and Wealth in Context. https://www.ers.usda.gov/topics/farm-economy/farm-household-well-being/income-and-wealth-in-context/
US President, Council of Economic Advisors. March 2023. Economic Report of the President, 2020. https://www.govinfo.gov/app/collection/erp/2023
Disclaimer: We request all readers, electronic media and others follow our citation guidelines when re-posting articles from farmdoc daily. Guidelines are available here. The farmdoc daily website falls under University of Illinois copyright and intellectual property rights. For a detailed statement, please see the University of Illinois Copyright Information and Policies here.