


Cover Crops and Covered Cropland, 2022 US Census of Agriculture
Cover crops are a farming practice that can reduce negative environmental impacts. Public subsidies are provided to encourage them. Nevertheless, area in cover crops increased less between 2017 and 2022 than between 2012 and 2017. Moreover, other covered cropland has declined including cropland in commercial fall-seeded crops (particularly winter wheat and forages), land in the Conservation Reserve Program, and pasture and forage land that can be converted into cropland without additional improvement (see Data Note). These findings raise questions about current US policy initiatives in this area of farm environmental policy, including the level of subsidy needed.
Census Question
The 2012, 2017, and 2022 Census of Agriculture asked respondents, “…, considering the cropland acres on this operation, how many acres were planted to a cover crop? (Cover crops are planted primarily for managing soil fertility, soil quality, and controlling weeds, pests, and diseases.) Exclude CRP.” (see Census Appendix). This wording means a cover crop could be planted after a crop is harvested or be the only use of land during the census year.
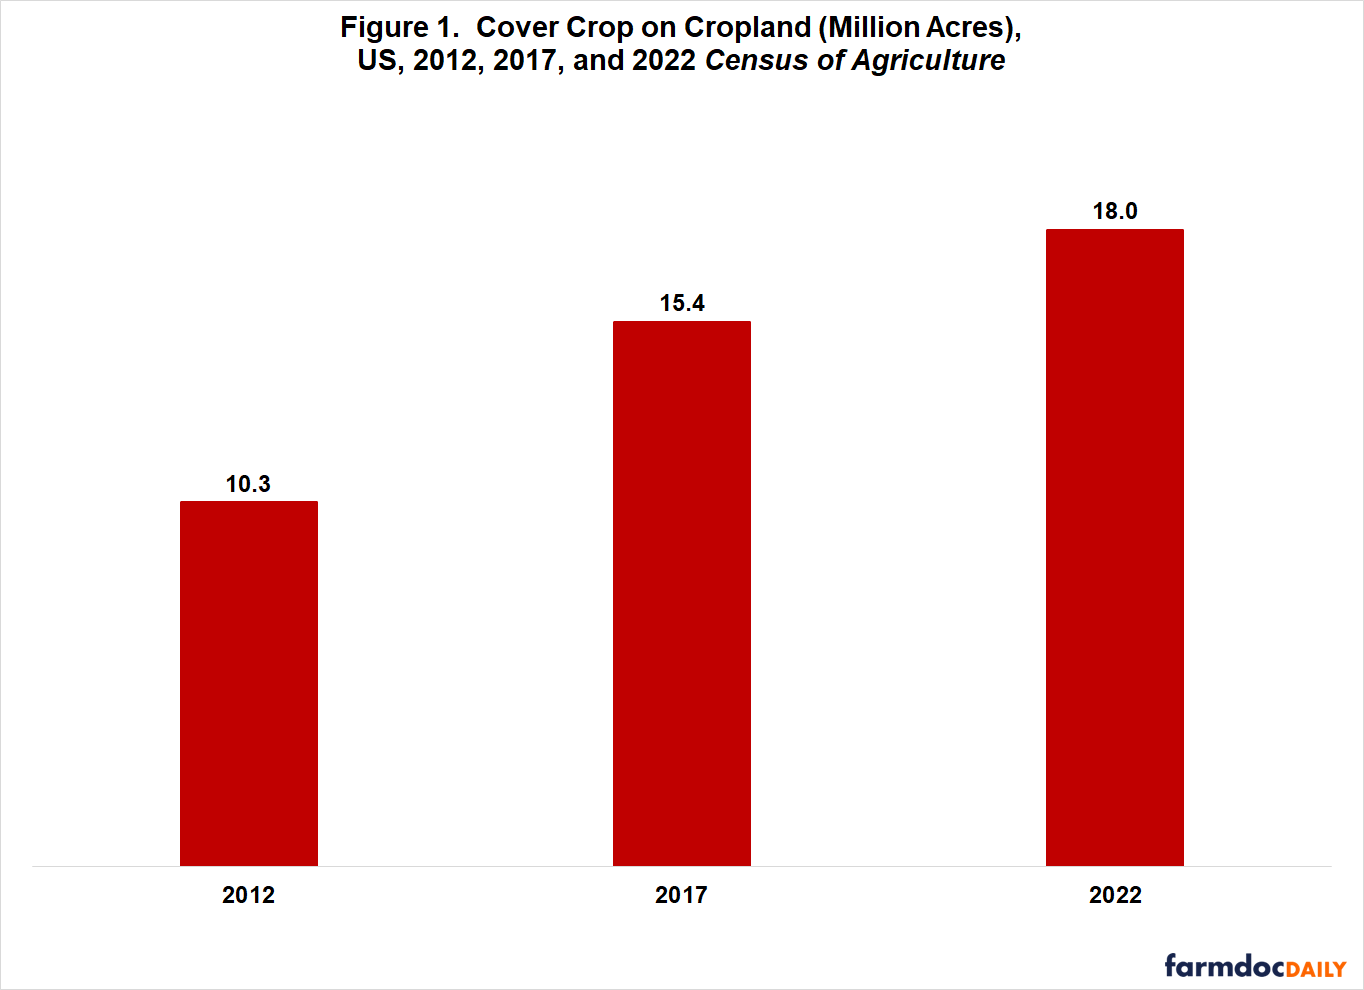
Cover Crops, US
The 2022 Census reported 18.0 million acres of cover crops, 2.6 million or 17% more than the 2017 Census (see Figure 1). In comparison, cover crop acres increased 5.1 million or 50% between the 2012 and 2017 Census.
Cover Crops, Largest States
Texas had both the largest number (1.55 million) of cover crop acres in 2022 and the largest increase (0.54 million) in cover crop acres between 2017 and 2022 (see Figure 2). Iowa had the second largest acres (1.28 million) while North Dakota had the second largest increase (0.43 million). Iowa was the only other state with an increase that exceeded 0.25 million acres. For a discussion of changes in cover crop use by state between the 2012 and 2017 Census, see the farmdoc daily of July 24, 2019.

The 13 states in Figure 2 had more than 0.5 million acres in cover crops during 2022. They accounted for 65% of US cover crop acres in 2022 and 92% of the increase from 2017. Nine of the states in Figure 2 were among the 10 states that had the most acres in the Pandemic Cover Crop Program (PCCP) for the 2021 crop year (see American Farmland Trust). PCCP provided a subsidy on crop insurance premium of up to $5 per acre if a cover crop was planted. North Dakota had the most acres In PCCP, followed by Texas, Iowa, Indiana, and Missouri. PCCP was also in effect for the 2022 crop year (see USDA, RMA (US Department of Agriculture, Risk Management Agency)). PCCP likely impacted the number of cover crop acres reported in the 2022 Census.
Covered Cropland, US
Between 2012 and 2022, acres changed little for forages as well as for pasture and grazing land that could be cropped without additional improvements (see Figure 3). However, winter wheat and cropland in CRP declined, especially between 2012 and 2017. Cropland in CRP includes land in WRP (Wetlands Reserve Program), FWP (Farmable Wetlands Program), and CREP (Conservation Reserve Enhancement Program).

Among CRP’s environmental benefits is that former cropland has a cover on it during the non-commercial crop season, but CRP and cover crop subsidies have different policy goals. Cover crop subsidies impact working lands. CRP is a multiple-year land retirement program. Nevertheless, it is interesting that the 6.4 million acre decline in CRP between 2012 and 2022 largely offsets the 7.7 million acre increase in cover crops. The Federal budget has, however, been positively impacted because average subsidy per cover crop acre is less than average CRP rental rate per acre.
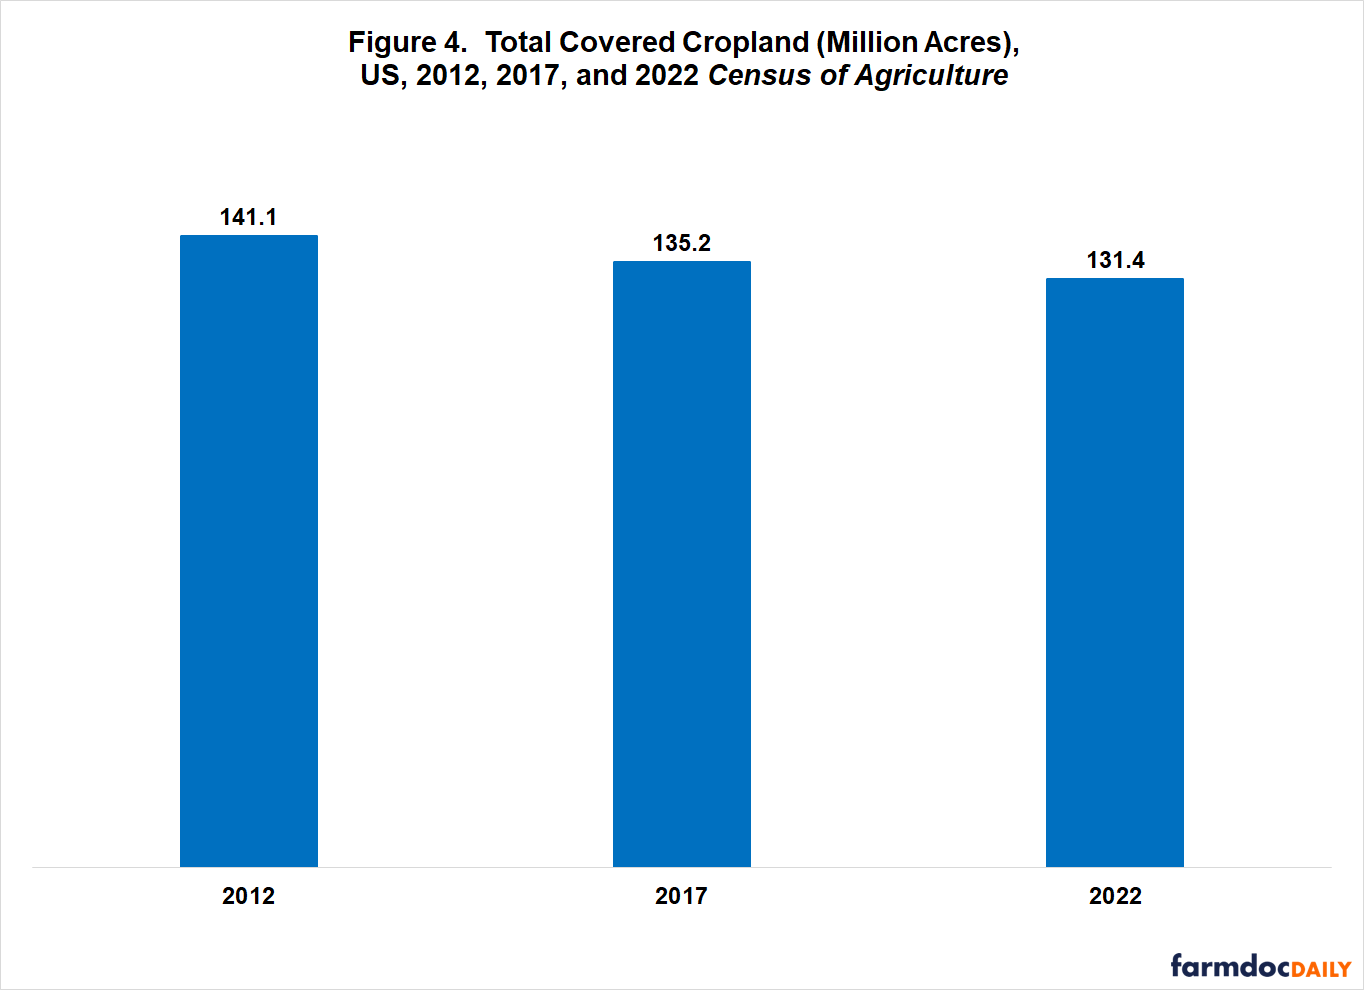
Total Covered Cropland, US
Total covered cropland declined nearly 10 million acres or -4% between 2012 and 2022 (see Figure 4). The decline was slower between 2017 and 2022 (-3%). Total covered cropland includes land in cover crops, winter wheat, and forages as well as cropland in CRP and pasture and grazing land that can be cropped without additional improvement.
Discussion
Cover crops increased less between 2017 and 2022 than between 2012 and 2017. This finding raises the question, “Are current cover crop incentive payments too low?” The adoption of crop insurance may be a useful analogy. Insured acres increased as subsidy levels on crop insurance were increased (see farmdoc daily of January 27, 2022). Moreover, subsidy levels may need to be above the costs of planting cover crops as farmers may require a return to cover risks and provide a return on their investment. Subsidy levels near $50 per acre may be needed (see farmdoc daily of January 27, 2022).
Performance of cover crops is also likely to vary by agro-environmental conditions, including the crops preceding and following a cover crop (see Myers, Weber, and Tellatin, June 2019; and farmdoc daily of January 25, 2024). Cover crop performance is thus likely to be a distribution, which implies that the most compatible land will be committed to cover crops first. Again, the adoption of crop insurance may be a useful analogy. Each 1% increase in the share of US planted acres that are insured is associated with a 0.35% increase in the ratio of the crop insurance premium subsidy to farm-paid premium (see farmdoc daily of January 27, 2022). In summary, the cover crop subsidy may not be a fixed value but may need to be an increasing function of the share of acres planted to cover crops.
Perhaps more importantly, the increase in cover crops did not offset the decline in other cropland uses that also cover cropland in the usual US non-commercial crop season (i.e. winter). These crops may provide some, maybe many, of the same environmental benefits as cover crops, prompting the question, “Is the current focus on cover crops too narrow of a policy perspective?” Research is needed to compare the environmental benefits of cover crops vs. wheat, forages, and pasture as well as the environmental performance of subsidies to cover crops vs. CRP.
From a private business perspective, cover crops provide environmental benefits but it is not clear that that their benefits to a private business will cover the cost of planting them even over the long term (Schnitkey, Sellars, and Gentry, 2023). Another option may be to provide subsidies for a commercially-viable crop that provides the desired environmental benefits. For example, a subsidy for wheat followed by double-crop soybeans may be a viable policy alternative.
Data Note
The Census category, “pasture and grazing land that could have been used for crops without additional improvements,” includes crop acres hogged or grazed but not harvested prior to grazing. Cropland pastured before or after crops were harvested is included as harvested cropland, not cropland for pasture or grazing.
References and Data Source
American Farmland Trust. May 17, 2022. What states received the most pandemic cover crop program funding. https://farmland.org/what-state-received-the-most-pandemic-cover-crop-program-funding/
Myers, R, Weber, A. and Tellatin, S. June 2019. Cover Crop Economics: Opportunities to Improve Your Bottom Line in Row Crops. SARE Technical Bulletin, US Department of Agriculture, National Institute of Food and Agriculture. https://www.sare.org/wp-content/uploads/Cover-Crop-Economics.pdf
Schnitkey, Gary D., Sarah C. Sellars, and Laura F. Gentry. 2023. “Cover Crops, Farm Economics, and Policy.” Applied Economic Perspectives and Policy 1–14. https://doi.org/10.1002/aepp.13404
Schnitkey, G. and L. Gentry. “Robust Cover Crop Systems for Soybeans.” farmdoc daily (14):17, Department of Agricultural and Consumer Economics, University of Illinois at Urbana-Champaign, January 25, 2024.
Schnitkey, G., S. Sellars and L. Gentry. “Yield and Yield Risks of Cover Crops in East-Central Illinois.” farmdoc daily (13):180, Department of Agricultural and Consumer Economics, University of Illinois at Urbana-Champaign, October 3, 2023.
US Department of Agriculture, National Agricultural Statistics Service. February 2024. 2012, 2017, and 2022 Census of Agriculture. https://www.nass.usda.gov/AgCensus/
US Department of Agriculture, Risk Management Agency. March 2022. Pandemic Cover Crop Program. Fact Sheet. https://www.rma.usda.gov/en/Fact-Sheets/National-Fact-Sheets/Pandemic-Cover-Crop-Program
Zulauf, C. and B. Brown. “Cover Crops, 2017 US Census of Agriculture.” farmdoc daily (9):135, Department of Agricultural and Consumer Economics, University of Illinois at Urbana-Champaign, July 24, 2019.
Zulauf, C. and G. Schnitkey. “Policy Budget for Cover Crops and the Lesson of Crop Insurance.” farmdoc daily (12):12, Department of Agricultural and Consumer Economics, University of Illinois at Urbana-Champaign, January 27, 2022.
Disclaimer: We request all readers, electronic media and others follow our citation guidelines when re-posting articles from farmdoc daily. Guidelines are available here. The farmdoc daily website falls under University of Illinois copyright and intellectual property rights. For a detailed statement, please see the University of Illinois Copyright Information and Policies here.