Exploring Yield Growth: US Crops in a Global 21st Century Context
Yield growth is critical to increasing crop output in the United States. US harvested land has been stable during the 21st Century and thus has not contributed to increasing US crop output (see farmdoc daily March 6, 2024). This study finds US yield growth varies by measure, crop, and comparative benchmark. Combined feed grain, food grain, and oilseed yield increased more for the US than any world region when measured in physical output units, but was in the middle when measured as percent increase. The US has a yield growth advantage in some crops, notably peanuts and soybeans; but for most crops lags the rest of the world, especially in percent increase. See data note.
Data
Average yield of feed grains, food grains, and oilseeds in 2000-2002 and 2020-2022 are compared for the US and the rest of the world (i.e. world excluding the US) using data from the Production, Supply, and Distribution Online (PSD) database (US Department of Agriculture, Foreign Agriculture Service). Feed grains are barley, corn, millet, oats, and sorghum. Food grains are rice, rye, and wheat. Oilseeds are cottonseed, peanuts, rapeseed, soybeans, and sunflowers. For a list of countries in each world region, see https://apps.fas.usda.gov/psdonline/app/index.html#/app/about.
Yield’s Relative Role in Increasing Production
Calculating yield’s role in increasing crop output involves (1) multiplying the change in average yield over 2000-2002 to 2020-2022 by average annual harvested acres in 2000-2002 (i.e. the start of the period), then (2) comparing this multiplicative product to the total change in production over the period. The calculation was made for the combined yield of the 13 feed grains, food grains, and oilseeds.
Increasing yield explained all US and EU (European Union) growth since 2000 in combined feed grain, food grain, and oilseed output (see Figure 1) as their harvested land did not increase (see farmdoc daily March 6, 2024). Yield accounted for two-thirds to three-quarters of the growth in combined output in South Asia, East Asia, Southeast Asia, and the collective category, “other regions.” Yield was the majority factor in the Former Soviet Union, but land was the majority factor in Sub-Saharan Africa and South America.
The percentages in Figure 1 are yield’s minimum contribution (excluding the US and EU). Yield’s total contribution also includes the interaction effect between growth in yield and growth in harvested land. Since 2000, harvested land has increased in every region, including North America, except the EU (see farmdoc daily March 6, 2024). Note, in all figures in this study, North America includes the US.
Growth in Combined Yield by Region
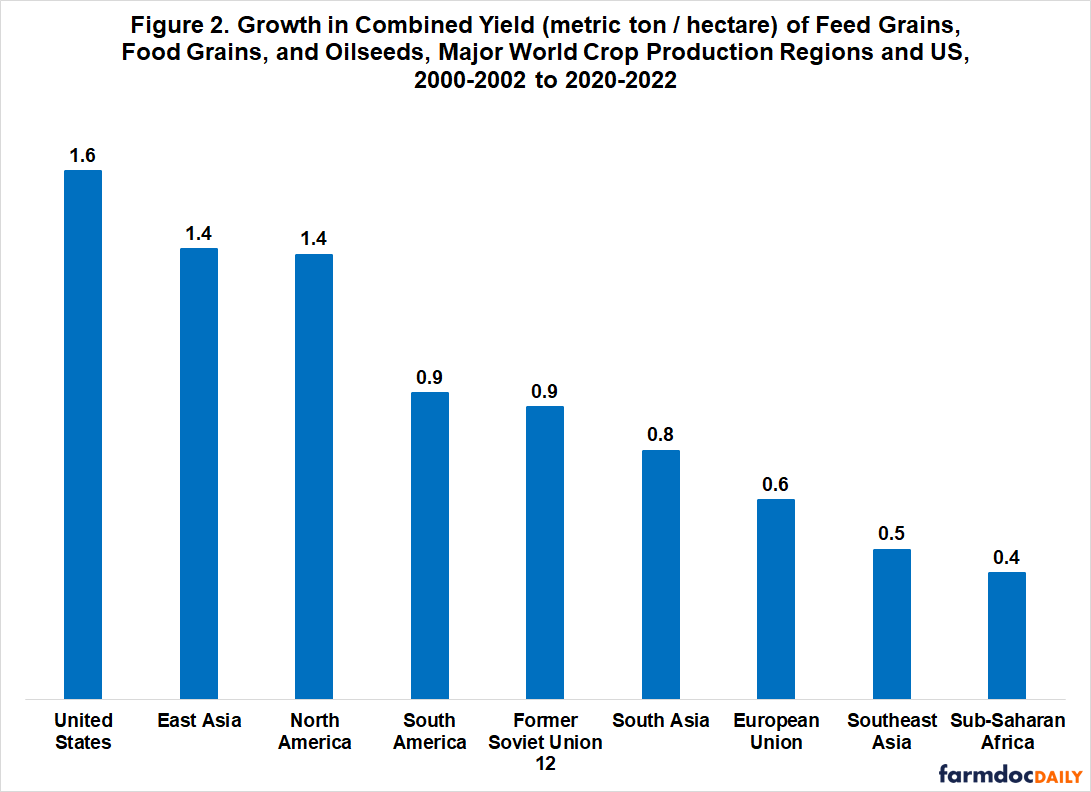
Besides North America, only East Asia had a growth in combined yield that exceeded one metric ton per hectare between 2000-2002 and 2020-2022 (see Figure 2). The US combined yield growth of 1.6 metric tons per hectare was close to, if not double or more, the growth for all other regions. Physical unit yield growth was smallest in Southeast Asia and Sub-Saharan Africa (0.5 and 0.4 metric ton per hectare, respectively).
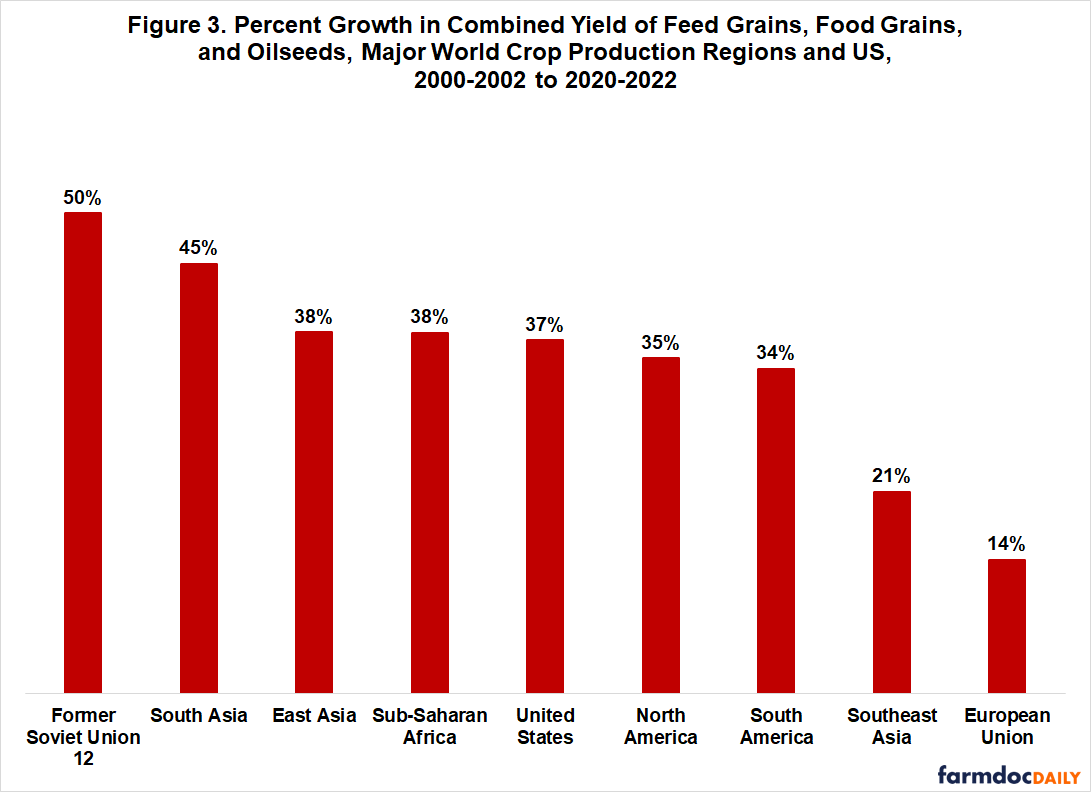
A different picture emerges when the measure is percent growth. The US is firmly in the middle at 37% (see Figure 3). The range is from 50% for the Former Soviet Union and 45% for South Asia to 21% for Southeast Asia and 14% for the EU. A gap exists between both ends and the middle of this distribution.
Yield Growth by Crop, US vs. Rest of World
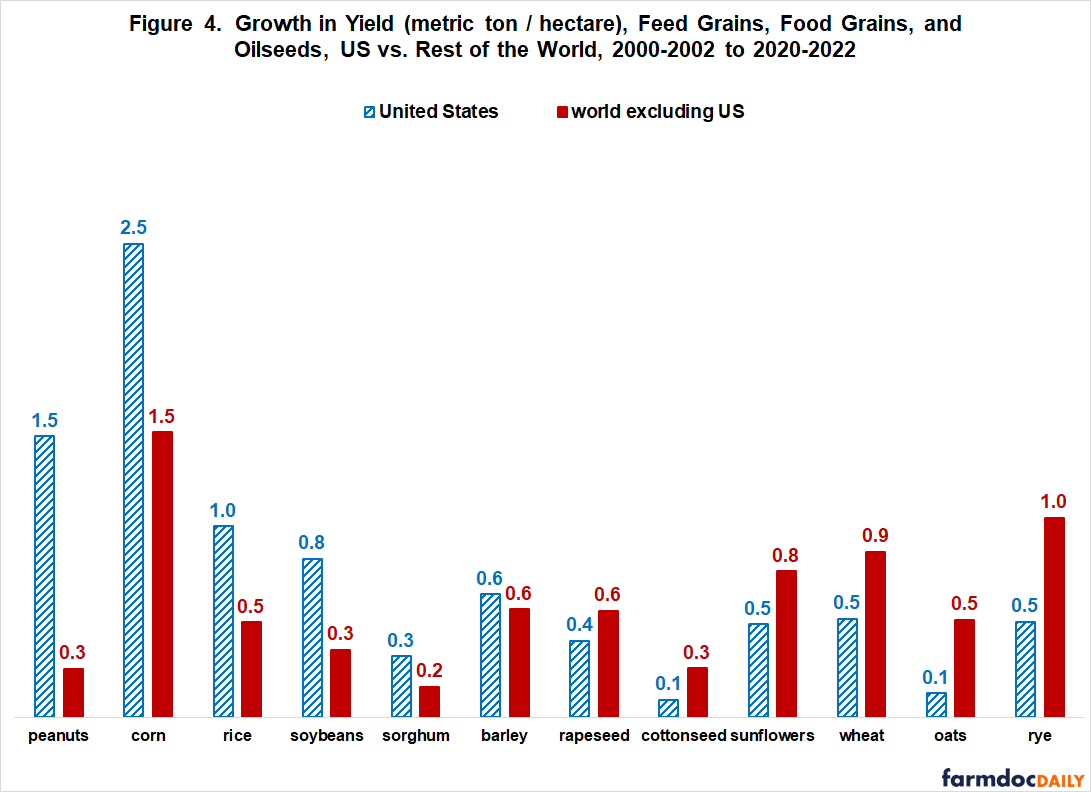
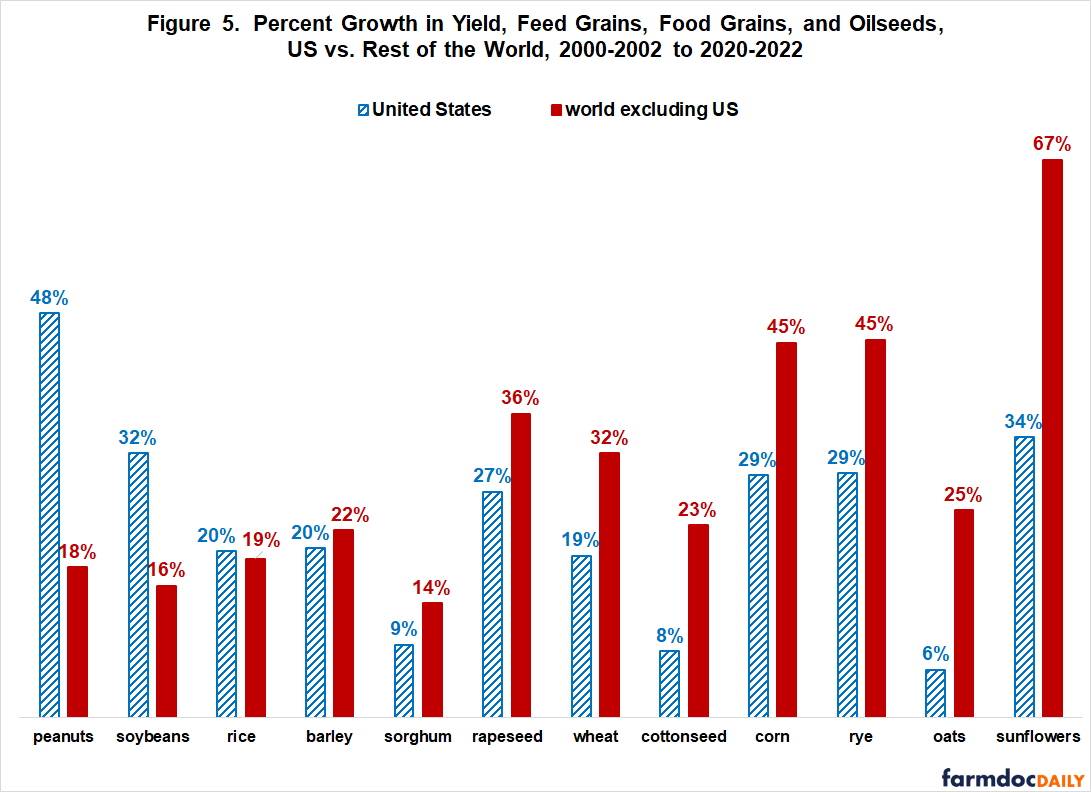
Compared to the rest of the world, the US had a notable advantage for peanuts and soybeans both in physical output unit growth and percent growth (see Figures 4 and 5). The US likely also had an advantage in rice and held its own in barley. A mixed picture emerges for sorghum and especially corn, with the US better on one measure but worse on the other measure. For corn, the US had a notably higher growth in physical yield (2.5 vs. 1.5 metric tons per hectare) but a notably lower percent growth (29% vs. 45%). For the remaining six crops, which includes wheat; US yield growth lagged the rest of the world on both measures, especially percent growth.
Discussion
US yield growth varies relative to the rest of the world. Combined feed grain, food grain, and oilseed yield has increased more for the US than for any world region when measured in physical output unit, but is middle of the pack when measured as percent increase. At the individual crop level, the US has outperformed the rest of the world on peanuts, soybeans, and probably rice, but lagged on wheat, sunflowers, cottonseed, rapeseed, rye, and oats.
Because yield growth is critical to increasing US crop output since US cropland is not increasing, it is important to understand the causes of the variation in US yield growth both relative to the rest of the world and across crops. What are the roles of genetics, tillage practices, soils, management, irrigation, climate change, and public policy, among other factors? Current understanding is murky at best, in part because so many factors are involved and because crop production is so site specific.
Nevertheless, the varied performance of US yield growth reinforces the policy questions raised in the farmdoc daily of March 6, 2024:
- Does the US need to put more research dollars into increasing multiple cropping of a given acre during a year?
- How should US field crop export programs be designed so the US, not the rest of the world, captures their expansion of demand when acres are not increasing and yield performance varies?
Data Note
Yield is a measure of the productivity of land, but land is not the only crop production input. Economists compute multifactor productivity to take into account other inputs. Yield influences multifactor productivity, but the relationship varies by time period, area, crop, and other factors. US crop agriculture likely ranks differently on different productivity measures. Change in productivity also likely varies by productivity measure. The latter is more relevant to this study as its focus is the growth in yield, not the level of yield.
References
US Department of Agriculture, Foreign Agriculture Service. March 2023. Production, Supply, and Distribution Online. https://apps.fas.usda.gov/psdonline/
Zulauf, C., J. Colussi, N. Paulson and G. Schnitkey. "Assessing US Performance: Land and 21st Century Field Crop Production." farmdoc daily (14):46, Department of Agricultural and Consumer Economics, University of Illinois at Urbana-Champaign, March 6, 2024.
Disclaimer: We request all readers, electronic media and others follow our citation guidelines when re-posting articles from farmdoc daily. Guidelines are available here. The farmdoc daily website falls under University of Illinois copyright and intellectual property rights. For a detailed statement, please see the University of Illinois Copyright Information and Policies here.


