Impacts of Corn Acreage Increases on National Corn Yields
Increases in demand for corn, particularly for use in ethanol, have led to more acres in corn production in the US since 2006. Increased acres have typically come from lower yielding areas, which then impact national US corn yield. We estimate that increased acres after 2006 reduced US average corn yields by 2.2 bushels per acre, also resulting in minor reductions in trend estimates of US corn yields. The additional acres in lower yielding areas can lead to understated gains if a productivity analysis is conducted using US corn yields.
Increase in US Corn Acres
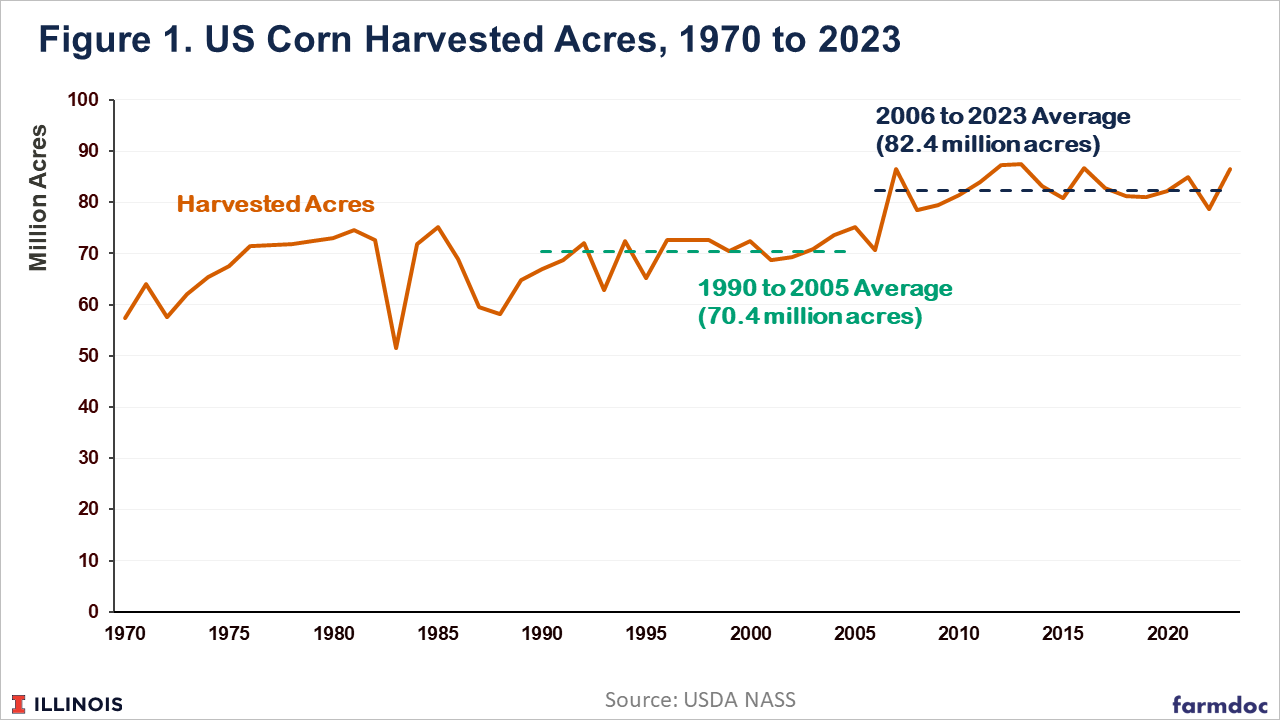
As illustrated in Figure 1 using data from USDA’s National Agricultural Statistics Service (NASS), US corn acres increased to what appears to be a new plateau around 2006 relative to previous years. This is a response to higher corn prices driven by higher domestic demand for ethanol and feed use as well as strong global demand for commodities (see farmdoc daily from September 27, 2023). From 1990 to 2005 harvested corn acres averaged 70.4 million. Since 2006, harvested corn acres have averaged 82.4 million per year, an increase of 17% from the 1990 to 2005 period.
The additional acres attracted into corn production have tended to be in areas with lower corn yields. Figure 2 shows state-level changes in average corn acres during the 2006-2023 period relative to 1990 to 2005. Average harvested corn acres increased by at least 100,000 acres in the 17 individual states reported in Figure 2, totaling more than 11.9 of the 12 million acre net increase. Harvested corn acres in Kansas increased by more than 2 million per year on average. Harvested corn acres increased by more than 1 million per year in North and South Dakota, Nebraska, and Minnesota.
The next 14 states increased corn harvested acres by an average of 383,000 per year (labeled Other (Net +) in Figure 2). A total of 10 US States saw harvested corn acreage decline by a combined average of 334,000 acres per year (labeled Other (Net -) in Figure 2).
Impact on US Corn Yields
Of the 17 individual states shown in Figure 2 where harvested corn acres increased, 11 have state-level corn yields that fall below the national average (these are indicated with red borders in Figure 2). Since the US average yield is equal to total US production divided by total US harvested acreage, additional acreage and production in lower-yielding areas will tend to drive down the US average corn yield even as total corn production increases.
To estimate the magnitude of the effect on US yield, we constructed simple estimates of what the US average corn yields might have been since 2006 if the levels and relative proportions of acres, and contributions to total US corn production, by state had not changed. Specifically, we compute estimates of US corn yields from 2006 to 2023 if corn acreage for a state had not increased, remaining around the average level from 1990 to 2005. We refer to these US corn yield estimates as “acreage adjusted” yield estimates.
As a specific example, consider corn production in Kansas – the state with the largest increase in corn acres. Harvested corn acreage in Kansas has averaged 4.47 million since 2006, up from 2.45 million between 1990 and 2005. Corn production and harvested acres for Kansas since 2006 were adjusted by multiplying by a factor of 0.55 (2.45 / 4.47 = 0.55). Similar factors reflecting acreage changes were applied to corn production and harvested acres in each state. The acreage adjusted state-level production levels were summed and divided by the sum of adjusted harvest acres since 2006 to compute the acreage adjusted US corn yield estimate for each year.
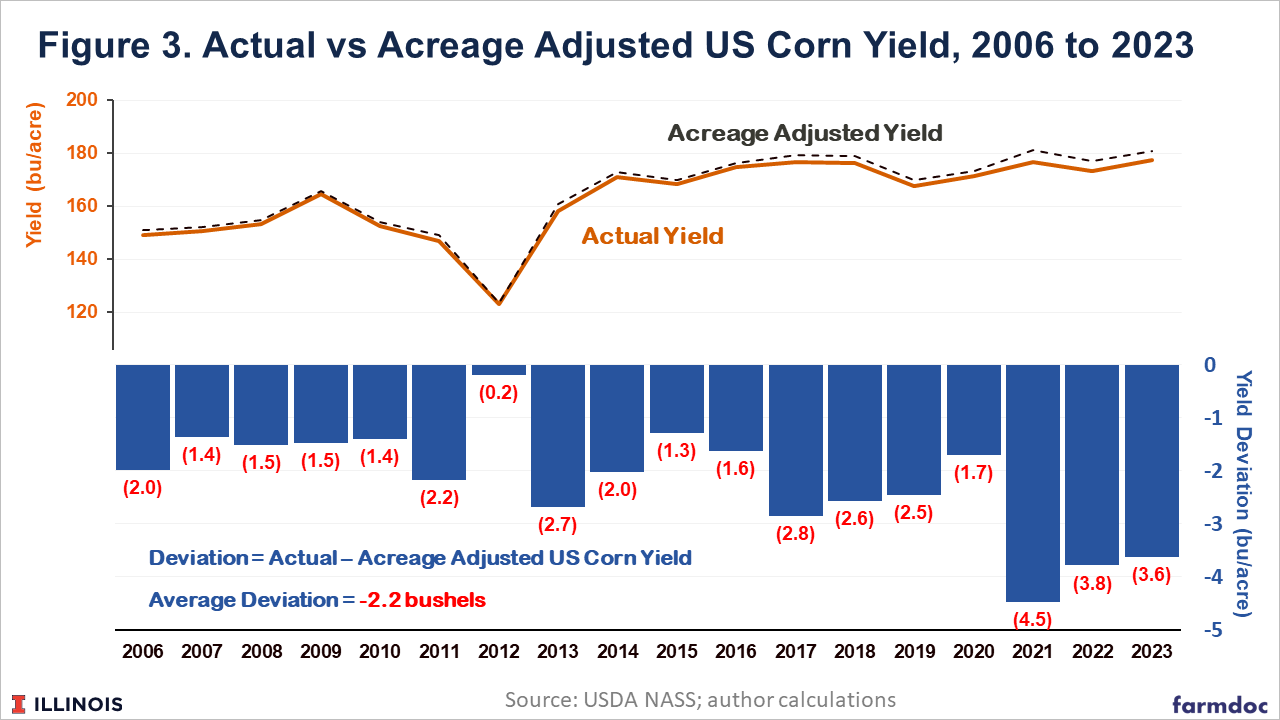
Figure 3 summarizes the difference between the acreage adjusted and actual US corn yields. For each year the acreage adjusted yields exceed the actual US corn yield. The yield deviations were largest in 2021 when the acreage adjusted yield of 181.2 bushels per acre was 4.5 bushels larger than the actual US average corn yield of 176.7 bushels per acre. The smallest deviation occurred for the drought year of 2012 when the actual US average corn yield of 123.1 bushels per acre was just 0.2 bushels below the acreage adjusted yield of 123.3 bushels per acre. On average, actual US corn yields were 2.2 bushels lower than the acreage adjusted yields.
Available NASS data on harvested corn acreage also suggests that non-trivial proportions of the increases in Texas, Nebraska, Oklahoma, Kansas and the Dakotas have been irrigated corn acres. This would tend to mute the any reduction in the US average corn yield due to the higher corn yields achieved with irrigation.
Impact on US Trend Yield Estimates
The yield effects of increased US corn acreage will also impact US trend yield estimates for corn. Lower US average yields since 2006 will tend to lower trend estimates, or expected annual increases in US corn yields. This is because the (larger) acreage adjusted years come at the end of the series used to estimate the trend and would thus tend to increase the slope of the trendline which is the trend yield estimate. This effect is exacerbated in this specific case by the fact that the deviations between the acreage adjusted and actual yields is largest in the most recent years – 3.8 to 4.5 bushel deviations from 2021 to 2023 compared with 2 bushel or smaller deviations in the earlier years (see Figure 3).
The impact on trend estimates will vary based on the number of years of data used to estimate the yield trend. Using a longer historical yield series to estimate yield trends will tend to dampen the yield effects as the relative weight of the 18 annual yields since 2006 will be smaller within a longer historical series.
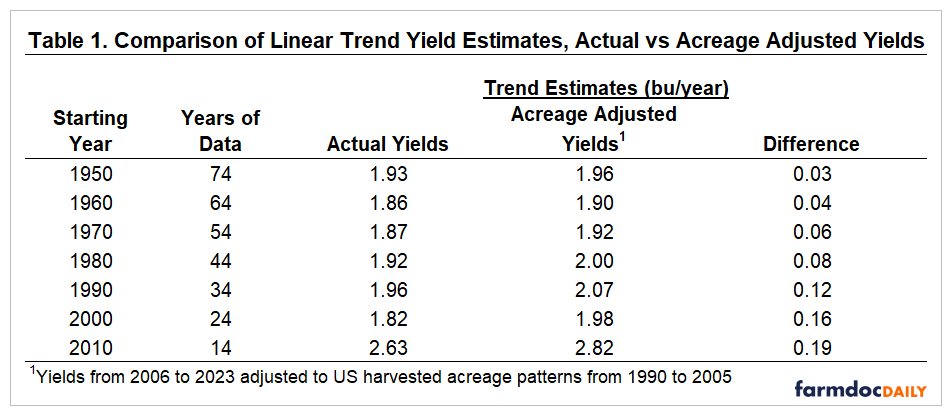
This is illustrated in Table 1, where yield trends estimated over different time horizons are compared. If yields from 1950 to 2023 (74 years) are used to estimate the US trend yield for corn, the actual yields suggest a yield trend of 1.93 bushels per year, or that the US corn yield has increased, on average, by 1.93 bushels per year since 1950. When the larger acreage adjusted yields from 2006 to 2023 are used, the trend yield estimate since 1950 increases to 1.96 bushels per year.
Trend estimates are provided with different starting years in Table 1. The fewer years of data used, the larger the difference between trend estimates based on the acreage adjusted yields and actual becomes. If trend estimates are based on data since 2000 (a total of 24 years), the difference in estimated yield trend increases to 0.16 bushels.
Basing trend on just the last 14 years since 2010, the trend estimate difference increases to 0.19 bushels. The more striking impact of using data only since 2010 is the relatively large impact on trend yield estimates in general, increasing to 2.63 based on actual yields compared with a trend estimate range of 1.82 to 1.96 bushels per year when based on the longer (actual) yield series. This highlights the importance of data selection and the sensitivity of trend estimates when relatively short histories are used. This topic will be the focus of a future farmdoc daily article.
Summary
Higher corn prices have incentivized more US corn acres. Acreage increases have occurred in areas where corn yields tend to be below the national average. As expected, this has reduced the US average corn yield. The size of this effect is estimated to be an average 2.2 bushel per year yield reduction since 2006.
Lower US corn yields due to increased acreage in lower yield areas has also marginally impacted US trend yield estimates for corn. The impact on trend yield estimates seems to be relatively small even when a shorter history is used to estimate yield trend.
Ultimately, the continuing increase in national corn yields becomes more remarkable when considering the change in corn acre composition. Any concerns with slowing trends in or levels of national yields should consider the changing composition of U.S. corn acres.
References
Irwin, S. and D. Good. "The New Era of Crop Prices: A 15-Year Review." farmdoc daily (13):176, Department of Agricultural and Consumer Economics, University of Illinois at Urbana-Champaign, September 27, 2023.
Zulauf, C., J. Colussi, N. Paulson and G. Schnitkey. "Exploring Yield Growth: US Crops in a Global 21st Century Context." farmdoc daily (14):56, Department of Agricultural and Consumer Economics, University of Illinois at Urbana-Champaign, March 20, 2024.
Disclaimer: We request all readers, electronic media and others follow our citation guidelines when re-posting articles from farmdoc daily. Guidelines are available here. The farmdoc daily website falls under University of Illinois copyright and intellectual property rights. For a detailed statement, please see the University of Illinois Copyright Information and Policies here.


