


Solvency Trends for Illinois Grain Farms: The Distribution of Debt-to-Asset Ratios by Gross Farm Returns
Since 2000, average debt-to-asset ratios on Illinois grain farms enrolled in Illinois Farm Business Farm Management (FBFM) have decreased, generally indicating that the solvency position of farms has improved. Still, we see some farms with high debt-to-asset ratios. There are marked differences in debt-to-asset ratios across grain farms of different sizes. This article continues our evaluation of the solvency position of Illinois grain farms (see farmdoc daily, April 24, 2024, December 18, 2018, and September 20, 2019).
Background
The debt-to-asset ratio is a measure of solvency and financial risk that expresses the share of a farm’s total assets owed to creditors. It is calculated by dividing the value of a farm’s total liabilities by its total assets.[1] In other words, it measures a farm’s ability to pay off all of its liabilities with its assets. The greater the debt-to-asset ratio, the greater the financial risk a farm faces. We examine the distribution of debt-to-asset ratios across grain farm sizes. We define small farms as those with gross farm returns less than $350,000, medium-sized farms as those with returns between $350,000 and $999,999, and large farms as those with returns greater than $999,999.
Figure 1 shows the percentage share of grain farms that fall into one of six debt-to-asset ratio categories: (1) 0 to 0.15, (2) 0.15 to 0.30, (3) 0.30 to 0.45, (4) 0.45 to 0.60, (5) 0.60 to 0.75, and (6) Greater than 0.75. According to most Financial Scorecard measures of the debt-to-asset ratio, the first two categories—0 to 0.15 and 0.15 to 0.30—are considered financially strong. Farms in these categories face little solvency risk and could take on more debt if opportunities for investment presented themselves. Farms with debt-to-asset ratios in the middle categories—0.30 to 0.45, 0.45 to 0.60—are considered stable, meaning that solvency is not a major concern, but additional debt-financed investments must be undertaken with great care. Farms with debt-to-asset ratios above 0.60 are considered vulnerable.
How Has the Distribution of Debt-to-Asset Ratios Changed over Time?
Compared to medium-sized and large grain farms, small farms constitute a larger share of financially strong (less than 0.15; 0.15 to 0.30) farms in Illinois. In 2003, 31.60% of small grain farms had a debt-to-asset ratio of less than 0.15, compared to 14.20% of medium-sized farms and 5.56% of large farms. On the opposite end of the ratio categories, 2.60% of small grain farms had a debt-to-asset ratio greater than 0.75, compared to 4.33% of medium-sized farms; no large grain farms had a debt-to-asset ratio greater than 0.75 in 2003. However, 50.00% of large farms had a ratio between 0.60 and 0.75 in 2003, compared to 9.48% of medium-sized farms and 6.47% of small farms. Over time, the share of grain farms with debt-to-asset ratios belonging to the strong categories (less than 0.15; 0.15 to 0.30) increased for all farm sizes.
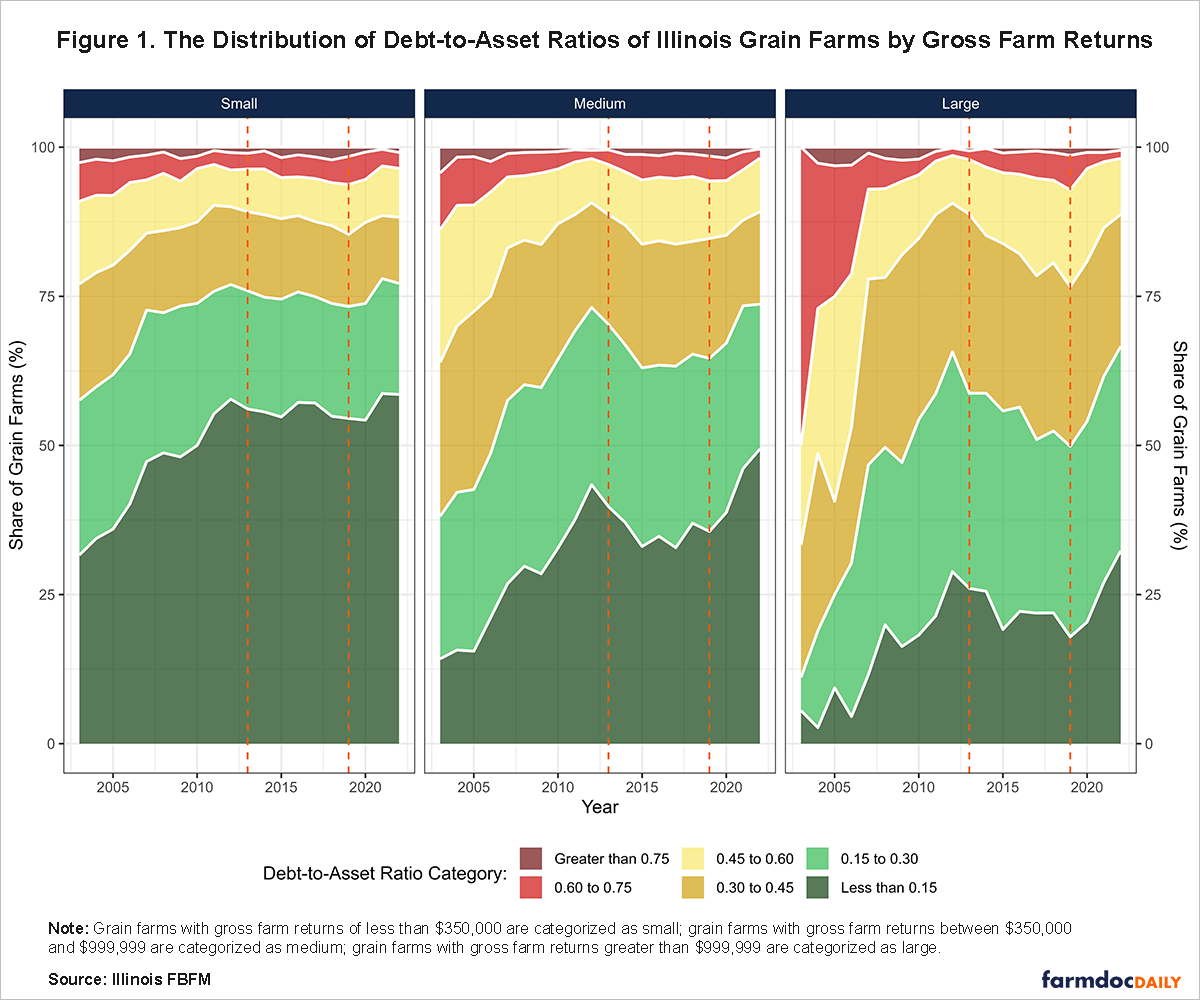
Between 2003 and 2013, the financial position of small, medium-sized, and large grain farms improved considerably. The share of small grain farms with a debt-to-asset ratio of less than 0.15 increased from 31.60% to 56.10%, while the share of small grain farms with a ratio between 0.15 and 0.30 decreased from 26.00% to 19.80%. Medium-sized grain farms with a ratio of less than 0.15 and between 0.15 and 0.30 increased from a share of 14.20% and 23.90% to 39.70% and 30.60%, respectively. Large farms also showed a significant strengthening of their financial position, with the share of farms with a debt-to-asset ratio of less than 0.15 increasing from 5.56% to 26.00%. At the same time, the share of large grain farms with a ratio between 0.15 and 0.30 increased from 5.56% to 32.70%. These improvements occurred during a period of substantial increases in grain prices, higher ending inventory values, and farm incomes. Moreover, the number of grain farms with debt-to-asset ratios greater than 0.60 decreased during this period. For example, the share of small grain farms with a ratio between 0.60 and 0.75 fell from 6.47% to 2.65%, medium-sized farms fell from 9.48% to 2.45%, and large farms fell from 50.00% to 1.46%. Furthermore, the share of small farms with a ratio greater than 0.75 fell from 2.60% to 1.04%, while the share of medium-sized farms fell from 4.33% to 0.46%. However, large farms experienced a slight increase from 0.00% to 0.63% by the end of the period.
Grain prices and farm incomes declined from 2013 to 2019. During this period, the solvency of grain farms in Illinois weakened, with medium-sized and large farms experiencing the largest declines. For example, the share of small grain farms with a ratio less than 0.15 fell from 56.10% to 54.50%, medium-sized farms fell from 39.70% to 35.60%, and large farms fell from 26.00% to 17.90%. The share of farms with a ratio between 0.15 and 0.30 also fell across all sizes, but the declines were more modest. However, the share of farms with a ratio between 0.45 and 0.60 increased across all sizes. For example, the share of small grain farms increased from 7.14% to 8.38%, medium-sized farms increased from 8.42% to 9.65%, and large farms increased from 9.17% to 16.30%. The share of grain farms in the vulnerable (0.60 to 0.75; greater than 0.75) categories also increased. Small grain farms with a debt-to-asset ratio between 0.60 and 0.75 increased their share from 2.65% to 4.69%, while the share with a ratio greater than 0.75 increased from 1.04% to 1.56%. Medium-sized and large farms exhibited similar increases. However, large farms had the highest share of ratios above 0.60 in 2019. The share of large farms with a ratio between 0.60 and 0.75 increased from 1.46% to 5.79%, while the share with ratios greater than 0.75 increased from 0.63% to 1.38%, bringing the total share above 0.60 to 7.17%.
The solvency of these farms has since improved. Grain prices rose sharply shortly after the start of the COVID-19 pandemic due to trade-related disruptions and rising energy and fertilizer costs. Medium-sized and large grain farms experienced the greatest improvement in their financial positions compared to their smaller counterparts. For example, the share of small grain farms with a debt-to-asset ratio of less than 0.15 increased from 54.20% in 2020 to 58.50% in 2022, while the share of small grain farms with a ratio between 0.15 and 0.30 decreased from 19.60% to 18.60%. On the other hand, medium-sized grain farms with a ratio of less than 0.15 increased their share from 38.80% to 49.40%, while the share between 0.15 and 0.30 decreased from 28.40% to 24.30%. Large farms with a ratio of less than 0.15 increased their share from 20.40% to 32.30%, while the share between 0.15 and 0.30 increased from 33.60% to 34.20%. Although the incidences of farms with ratios greater than 0.60 fell over the period, small farms held the highest share compared to medium-sized and large farms by 2022. As of 2022, 2.66% of small grain farms had a debt-to-asset ratio between 0.60 and 0.75, while 0.89% of them were greater than 0.75. The share of medium-sized farms that had a ratio between 0.60 and 0.75 was lower at 1.52%, while 0.33% were greater than 0.75. About 1.37% of large farms had a ratio between 0.60 and 0.75, while 0.53% were greater than 0.75.
Summary
It is worth noting the contribution of higher grain prices, farm incomes, and farmland values toward the improvement of the debt-to-asset ratios of grain farms in Illinois. Most importantly, the ratio of farms with strong (less than 0.15; 0.15 to 0.30) debt-to-asset ratios has increased over time, strengthening their solvency. This trend has been most prominent in larger farms. Interestingly, as the farm size increased, the share of farms with a ratio of less than 0.15 decreased. However, when looking at the other ranges of debt-to-asset ratios—0.15 to 0.30, 0.30 to 0.45, and 0.45 to 0.60—the shares of farms in each range increased as the farm size increased.
Although Illinois grain farms’ debt-to-asset ratios have been decreasing over time, it is also important to note that the projection for the years 2023 and 2024 is for lower farm incomes and returns. Thus, farmers need to carefully monitor their balance sheets to understand the impact of this ratio on their financial position.
Acknowledgment
The authors would like to acknowledge that data used in this study comes from the Illinois Farm Business Farm Management (FBFM) Association. Without Illinois FBFM, information as comprehensive and accurate as this would not be available for educational purposes. FBFM, which consists of 5,000+ farmers and 70 professional field staff, is a not-for-profit organization available to all farm operators in Illinois. FBFM field staff provide on-farm counsel along with recordkeeping, farm financial management, business entity planning and income tax management. For more information, please contact our office located on the campus of the University of Illinois in the Department of Agricultural and Consumer Economics at 217-333-8346 or visit the FBFM website at www.fbfm.org.
Note
[1] We use the market value of total assets in our analysis.
References
Mashange, G. and B. Zwilling. "Solvency Trends for Illinois Grain Farms." farmdoc daily (14):78, Department of Agricultural and Consumer Economics, University of Illinois at Urbana-Champaign, April 24, 2024.
Schnitkey, G. "Incidence of High Debt-to-Asset Ratios Grow Over Time." farmdoc daily (8):231, Department of Agricultural and Consumer Economics, University of Illinois at Urbana-Champaign, December 18, 2018.
Zwilling, B. and D. Raab. "Solvency on the Farm." farmdoc daily (9):176, Department of Agricultural and Consumer Economics, University of Illinois at Urbana-Champaign, September 20, 2019.
Disclaimer: We request all readers, electronic media and others follow our citation guidelines when re-posting articles from farmdoc daily. Guidelines are available here. The farmdoc daily website falls under University of Illinois copyright and intellectual property rights. For a detailed statement, please see the University of Illinois Copyright Information and Policies here.