Trends in Input Costs for Corn and Soybean Production in Illinois
The costs of fertilizer, seed, and pesticide inputs have increased by 6-7% annually for corn and 4-6% annually for soybeans since the 2000 crop year. Input costs have, in general, followed patterns in commodity prices and farm returns.
Fertilizers have been the most variable input cost, increasing more rapidly during the high income era from 2007 to 2013, returning to lower levels from 2014 to 2019, and then increasing to record levels through 2023.
Seed costs experienced the most growth during the high income era which is also when the adoption of genetically engineered seed varieties on corn and soybean acres grew to their current levels.
Pesticide costs generally increased more gradually from 2000 until 2020 but have increased more significantly in recent years as weed resistance and disease pressures have increased along with price increases associated with pandemic-related supply chain issues.
Lower corn and soybean prices in 2024 will have producers seeking cost reductions. Some relief is expected for fertilizer costs due to lower prices but seed costs are expected to remain at 2023 levels and, with planting season underway, have likely already been fully realized. Pesticide costs may provide an opportunity for lower costs in 2024. However, lower costs will be realized only if lower pest pressures occur or farmers choose to reduce or forego applications during the growing season since prices generally remain at the higher levels seen in 2023.
Input Costs for Corn and Soybeans
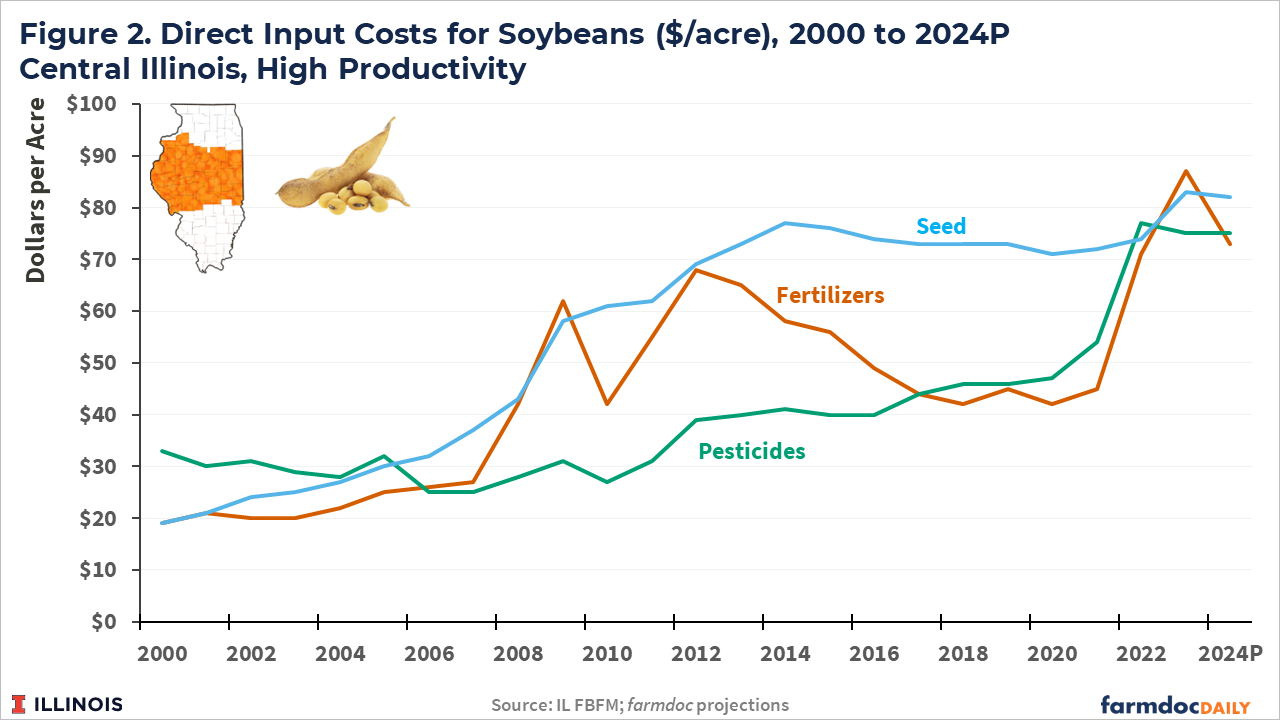
Figures 1 and 2 report direct input costs ($/acre) for fertilizers, seed, and pesticides for corn and soybeans, respectively, for the central Illinois, high-productivity region from IL FBFM. Costs from 2000 through 2023 are averages of FBFM cooperating members within the region while the 2024 costs are projections based on Illinois Crop Budgets.
Costs per acre for all three input categories have trended upward over the past 25 years for both corn and soybean production, reaching record or near record levels for the 2023 crop year. For example, input costs for corn increased from $118 per acre in 2000 ($53/acre for fertilizer, $32/acre for pesticides, $33/acre for seed) to $542 per acre in 2023 ($289/acre for fertilizer, $124/acre for pesticides, $129/acre for seed). The costs to produce corn and soybeans in 2023 across all Illinois regions are discussed in more detail in the farmdoc daily article from April 19, 2024.
Fertilizer costs have varied the most across time as fertilizer prices tend to be highly correlated with volatile global energy markets and corn prices (see farmdoc daily article from December 14, 2021). Fertilizer costs experienced large increases and volatility from 2007 to 2012, and then declined and plateaued from 2013 to 2020. Large increases were again experienced from 2021 to 2023, with a decline projected for 2024.
Seed costs per acre have increased more consistently over time, with the most rapid growth occurring from 2007 to 2013. They then plateaued from 2014 to 2022, with increases occurring from 2022 to 2023. The pattern in seed cost increases aligns with farm-level returns and commodity prices. It also is consistent with the increasing use of genetically engineered corn and soybean seed varieties until adoption rates leveled off around 90% for corn and 95% for soybeans in 2014 (USDA-ERS, 2023).
Pesticide costs have also followed a relatively consistent upward path until 2021. Since then, and in contrast to seed costs, pesticide cost per acre has substantially increased. Rising pesticide costs have previously been linked to increased weed resistance (see farmdoc daily article from June 5, 2018) and increased use of fungicides to address increasing disease pressures along with higher corn and soybean prices in more recent years (see farmdoc daily articles from November 14, 2023 and September 26, 2023; USDA-NASS, 2024).
Annualized Growth in Input Costs
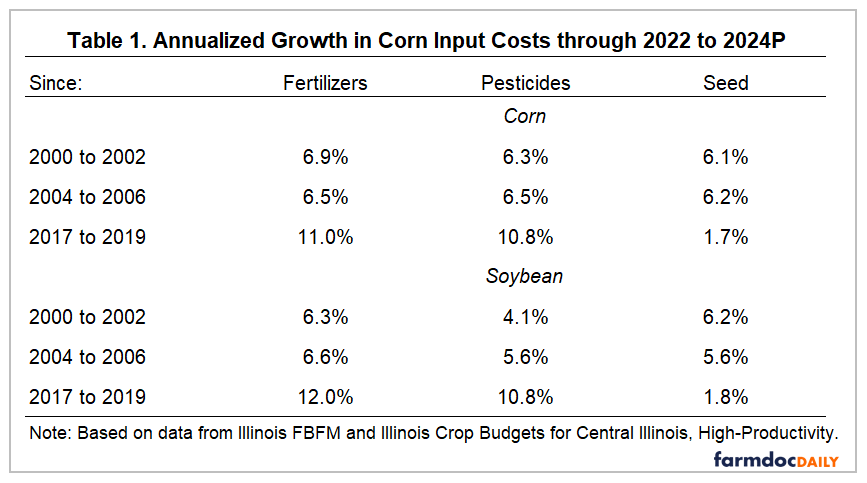
Table 1 reports annualized growth rates for the major inputs on corn and soybean acres over a range of historical periods. The average from 2022 to 2024P is the end point for each period. Each row of the corn and soybean panels in Table 1 consider a different starting point. Cost averages over 3-year periods are used to minimize the effect of variability for individual years.
Costs for all three major inputs for corn production have increased by 6% to 7% annually in central Illinois over the past 22 years (average annualized growth from 2000-2002 to 2022-2024P). Annual growth has been similar, around 6.5%, over the past 18 years (2004-2006 to 2022-2024P) – a period which starts just prior to the high income and rising cost era. Over the past 5 years (since 2017-2019), fertilizer and pesticide costs for corn production have increased by about 11% per year while seed costs have increased at less than 2% annually.
Relative costs increases for the inputs for soybean production show similar patterns. Fertilizer and seed costs have increased just over 6% annually over the past 22 years, while pesticide costs have increased 4.1% per year. Annual growth since just prior to the high income period has been 5.6% for both pesticides and seed and 6.6% for fertilizer. Growth in the most recent era has been nearly 11% annually for pesticides, 12% for fertilizers, and less than 2% for seed.
Input Cost Shares
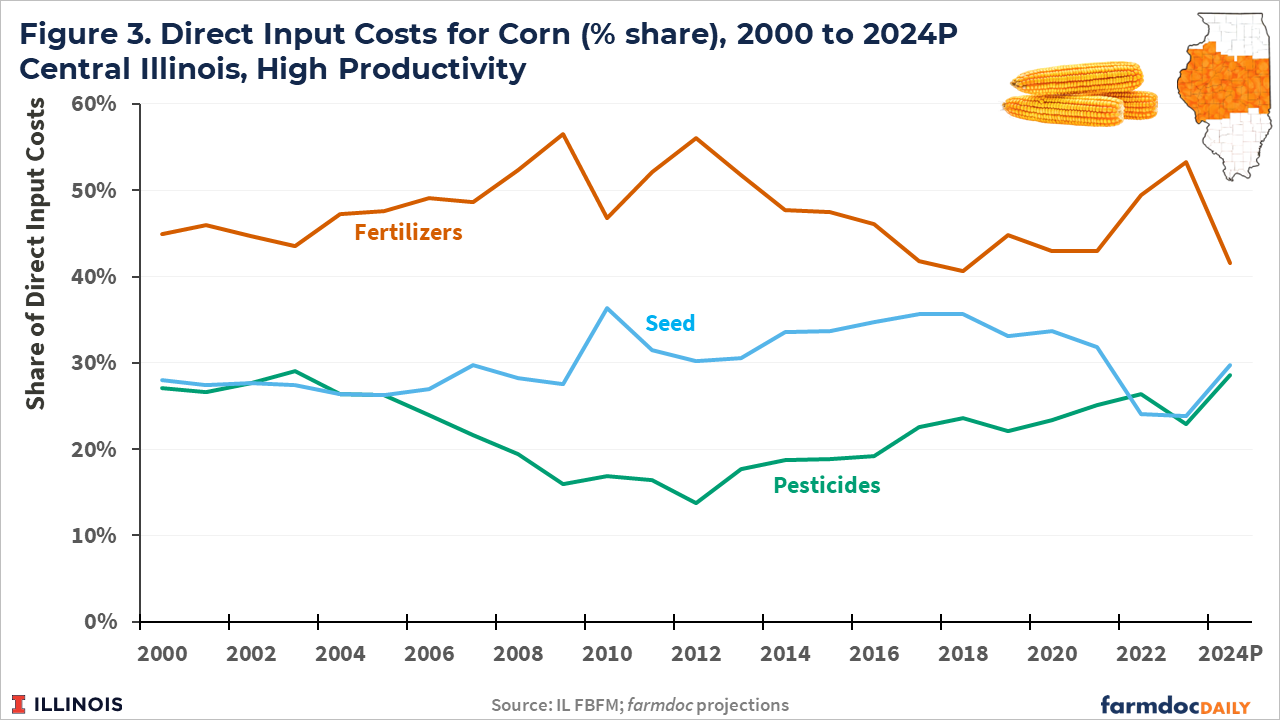
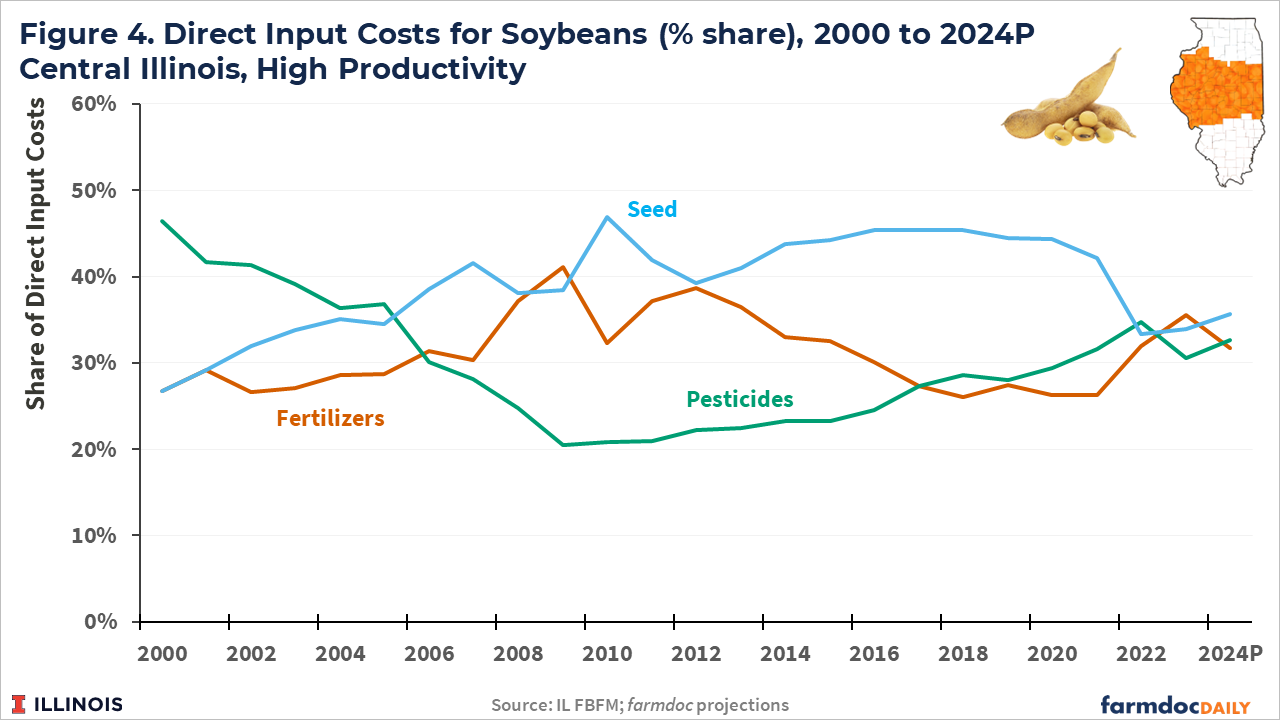
Cost shares as a percentage of total input costs are shown in Figures 3 and 4 for corn and soybeans in central Illinois, respectively. Among these three input categories, fertilizer is the largest component for corn production, varying between 40% and 55% through time. The cost share for seed on corn acres has averaged around 30%. The pesticide cost share declined from around 28% in 2000 to 15% in 2012 but has since increased back to nearly 30%.
The fertilizer cost share for soybean production has varied around 30%, reaching a high around 40% during the period of higher fertilizer costs following the Great Recession from 2008-2010. Seed’s cost share trended up from less than 30% in 2000 to around 45% by 2014. Since 2020 it has declined to around 34%. The pesticide cost share for soybeans declined from 47% in 2000 to 20% in 2009. Since 2009 it has trended upward to over 30% over the past 3 crop years.
Summary and Discussion
The cost of fertilizer, seed, and pesticide inputs for corn and soybean production have increased over the past 25 years at relatively similar rates on average. Fertilizers, being closely linked to both corn and energy prices, tend to be the most variable input with larger increases experienced from 2007 to 2013 and again from 2020 to 2023.
Seed costs for both corn and soybeans exhibited their largest increases prior to 2014 which also coincides with continued growth in adoption of GE seed varieties to current levels. Seed costs then plateaued from 2014 through 2022 with slight increases in 2023.
Pesticides costs grew at a slower but consistent rate until around 2020 for corn. Pesticide costs on soybean acres actually declined slightly from 2000 until around 2010 before increasing through 2020. Since 2020, pesticides costs for both corn and soybeans have increased more rapidly, nearly matching the percent increases in fertilizer costs realized from 2020 to 2023.
While the paths these input costs have differed, the relative importance of the three input categories have remained remarkably similar through time constant. This likely indicates some level of substitutability across input categories as well as responses to new production tools and technologies.
Significantly lower commodity prices for the 2024 crop year will force producers to identify areas for costs savings. Some relief is expected for fertilizer costs due to lower prices for fertilizer products. Seed and pesticide costs are expected to remain relatively stable at 2023 levels but farmers may approach crop protection needs differently during the 2024 growing season. Our next article will take a closer look at fungicide decisions and how they might be approached with the lower corn and soybean price prospects in 2024 compared with recent years.
References
Paulson, N., G. Schnitkey, C. Zulauf and J. Colussi. "The Rising Costs of Soybean Production in Illinois." farmdoc daily (13):208, Department of Agricultural and Consumer Economics, University of Illinois at Urbana-Champaign, November 14, 2023.
Paulson, N., G. Schnitkey, C. Zulauf, J. Colussi and J. Baltz. "The Rising Costs of Corn Production in Illinois." farmdoc daily (13):175, Department of Agricultural and Consumer Economics, University of Illinois at Urbana-Champaign, September 26, 2023.
Schnitkey, G. and N. Paulson. “Illinois Crop Budgets, 2024.” Department of Agricultural and Consumer Economics, University of Illinois at Urbana-Champaign, January 2024.
Schnitkey, G., N. Paulson, C. Zulauf, K. Swanson and J. Baltz. "Nitrogen Fertilizer Prices Above Expected Levels." farmdoc daily (11):165, Department of Agricultural and Consumer Economics, University of Illinois at Urbana-Champaign, December 14, 2021.
Schnitkey, G. "Historic Fertilizer, Seed, and Chemical Costs with 2019 Projections." farmdoc daily (8):102, Department of Agricultural and Consumer Economics, University of Illinois at Urbana-Champaign, June 5, 2018.
USDA-ERS. 2023. Recent Trends in GE Adoption. Economic Research Service, USDA.
USDA-NASS. 2024. Agricultural Chemical Use Surveys, various years. National Agricultural Statistics Service, USDA.
Zwilling, B. "Cost to Produce Corn and Soybeans in Illinois—2023." farmdoc daily (14):75, Department of Agricultural and Consumer Economics, University of Illinois at Urbana-Champaign, April 19, 2024.
Disclaimer: We request all readers, electronic media and others follow our citation guidelines when re-posting articles from farmdoc daily. Guidelines are available here. The farmdoc daily website falls under University of Illinois copyright and intellectual property rights. For a detailed statement, please see the University of Illinois Copyright Information and Policies here.


