What Explains the Disparity between USDA and Conab over Brazil’s Soybean Crop Size?
Brazil leads the world in soybean production. News about the size of Brazil’s crop moves markets, but an ongoing debate about which numbers to trust is adding uncertainty to the current market situation (e.g. Braun, 2024; Siqueira, 2024; Vaclavik, 2024). There are two major public sources for agricultural production statistics, the United States Department of Agriculture’s World Agricultural Supply and Demand Estimates (WASDE) and Brazil’s National Supply Company, typically referred to by its Portuguese name and abbreviation: Companhia Nacional de Abastecimento (Conab). In the past six years, Brazil soybean production estimates from each agency have diverged. The current gap between USDA and Conab is wider than ever before.
We examine two broad explanations for the growing difference between USDA and Conab soybean production estimates: methods and data used to forecast production and reconciliation with data on use. We show that current production estimates can only be understood in relation to use and ending stocks estimates, which have also differed between USDA and Conab. To develop consensus between the two agencies about Brazil soybean production, major revisions to historic production and use data are needed. While private analysts and traders can and will continue to disagree with official government crop forecasts, such consensus about soybean production in Brazil would alleviate some of the current uncertainty about the global soybean supply and demand balance.
Differences in Procedures for Estimating Production
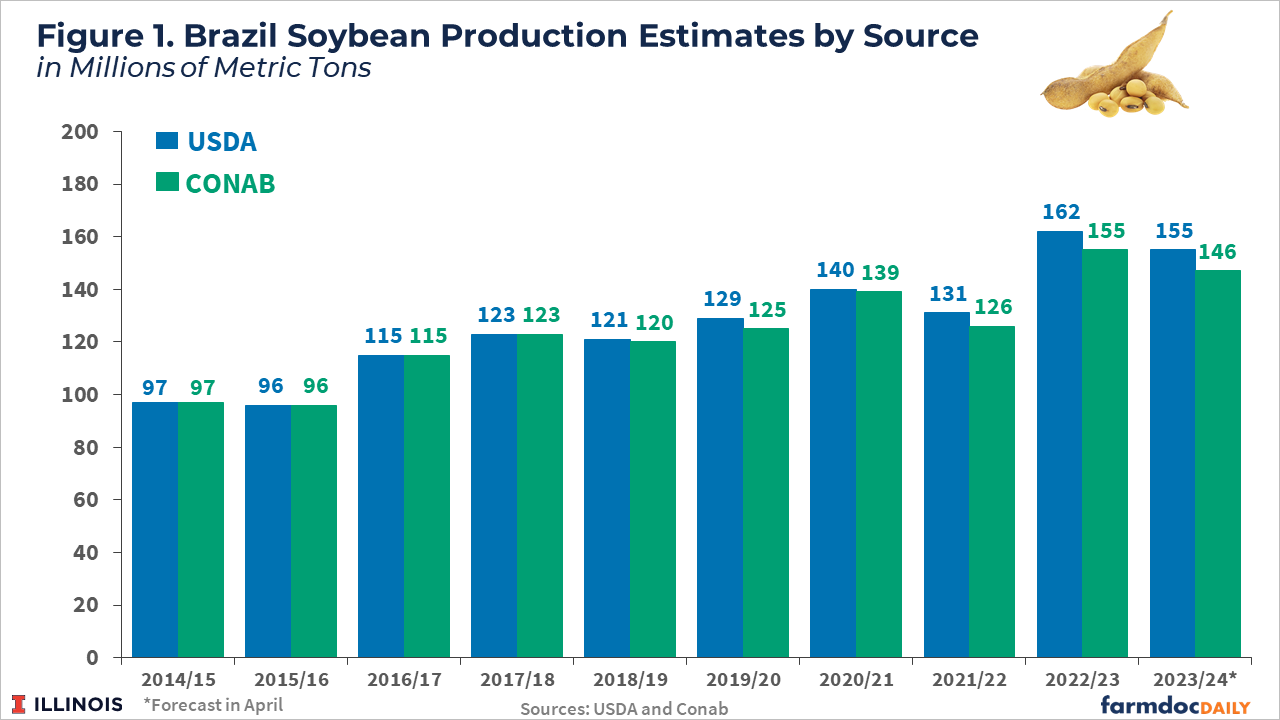
Since the 2018/19 marketing year, USDA’s Brazil soybean production estimate have generally exceeded Conab’s and the gap has widened over time (see Figure 1). For the current 2023/24 marketing year, USDA’s latest estimate of 155 million metric tons (about 5.7 billion bushels) exceeds Conab’s by 8.5 million metric tons (311 million bushels), or more than 5%.
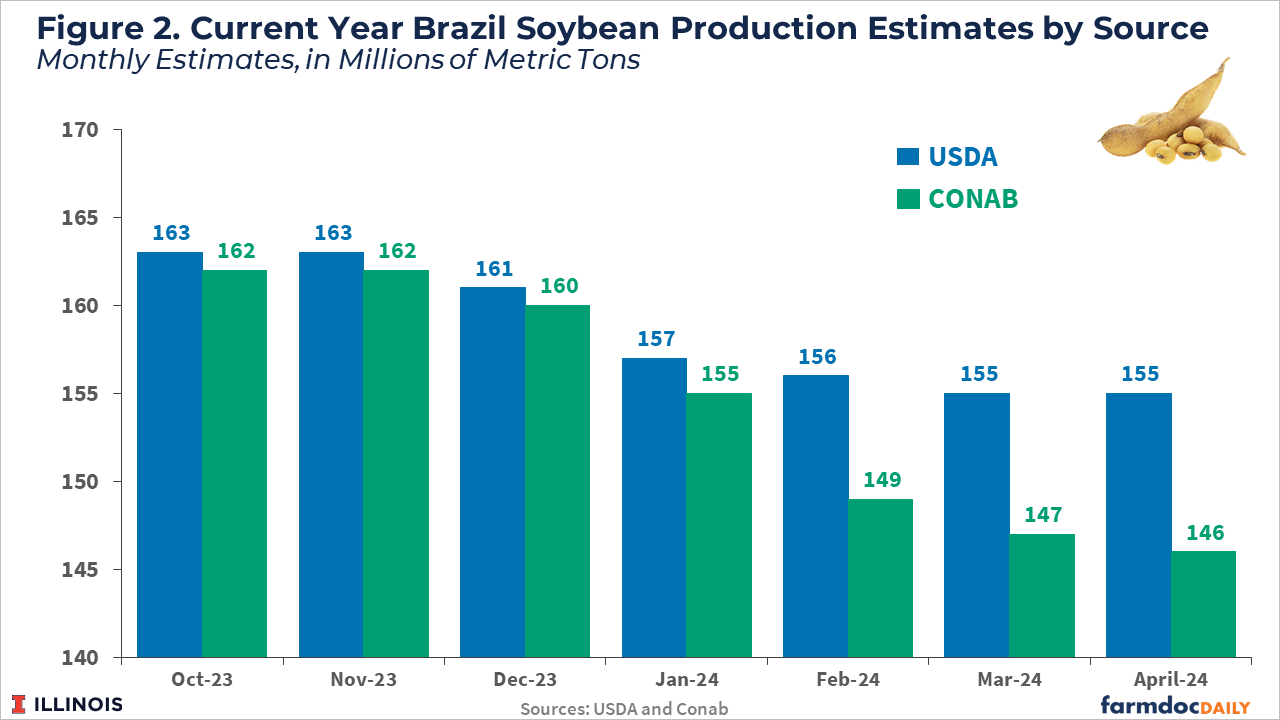
While both agencies have revised their 2023/24 estimates lower over time, USDA has kept their number comparatively higher (see Figure 2). Since last October, Conab has lowered their production estimate from 162 to 146.5 million metric tons. USDA has dropped their from 163 to 155 million metric tons. In their most recent estimates released in mid-April, USDA left Brazil soybean production unchanged, despite private analysts’ expectations that the number would drop on average by 2.7 million metric tons (100 million bushels).
Differences in forecasting methods may explain the USDA-Conab divergence. Both agencies use a variety of data inputs to estimate harvested area and yield, the product of which determines production. Data come from farmer surveys, field scouting, satellite data, and subjective expert assessment. The relative weights placed on each data source are unknown and may vary within and across marketing years. How each agency interprets the data is also likely to differ. Analysts at USDA and Conab each have their own models for processing data and making expert judgment about what the data mean for aggregate national production figures.
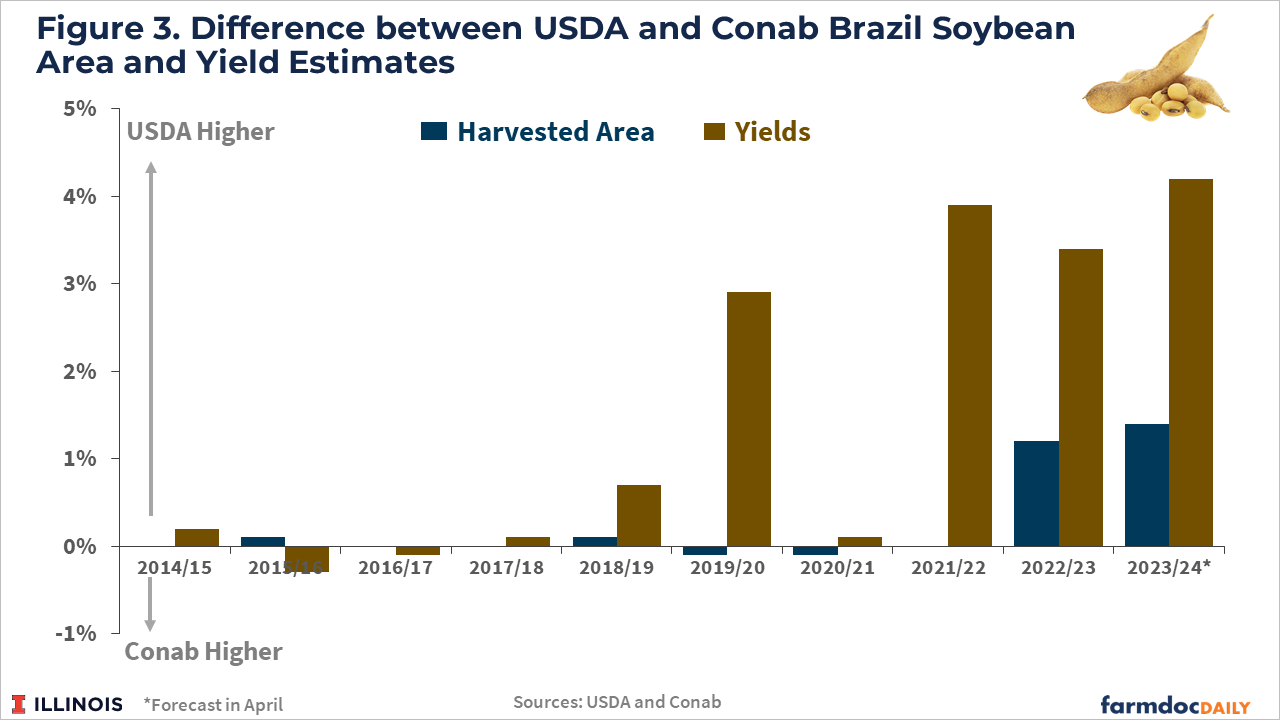
The current difference in forecasted production is the result of differences in both area and yield estimates. Figure 3 shows differences between USDA and Conab yield estimates opened up in 2018/19. Yield estimates have differed by roughly four percent in the last three crop years. Production differences in both 2022/23 and 2023/24 are the result of higher posted values from USDA for both area and yield. In the 2023-24 crop season, the USDA planted area estimate is 45.9 million hectares (113.4 million acres), while the Conab estimate is 45.2 million hectares (111.6 million acres).
Yield differences remain larger in percentage terms. In the 2023/24 crop season, USDA estimates Brazilian soybean yield will be 50.2 bushels per acre, while Conab’s estimate is 48 bushels per acre. This difference in estimated yields occurs in a crop season marked by adverse weather conditions. Although the first fields harvested had very poor yields, production recovered as the harvest progressed in late January and February. This occurred because the crops planted first were those most affected by the drought in the Center-West states, especially in Mato Grosso, the largest soybean producing state in Brazil.
In our view, differences in USDA and Conab production estimates are unlikely to be explained by further inquiry into production estimation methods. Knowing the relative emphasis each agency places on on-the-ground field scouting, satellite imagery data, or any other information is unlikely to lead to a consensus production estimate. The difference between USDA and Conab yield estimates has been remarkably similar for the past three crop years despite significant yield variability over the same period.
The pattern of yield and area deviations over time shown in Figure 3 suggests some external signal led one agency to revise its production estimate. Those revisions came in the form of a yield difference first. Once the implied yield deviation reached a magnitude that could not be justified by the available data, the agency inferred that harvested area must also differ. The obvious external signal in this case is information on soybean use in Brazil for domestic crushing and/or exports which must align with production estimates on the commodity balance sheet.
Reconciliation with Data on Use
On the commodity balance sheet, changes in production must be related to changes in use and ending stocks. In the case of Brazil soybeans, reasonably good use data are available on exports and domestic crush use. There is no survey data on soybean inventory like the Quarterly Grain Stocks report released by USDA’s National Agricultural Statistics Service. In the absence of comprehensive data on stocks, forecasters cannot true up estimates of other balance sheet quantities (for an example of this process in the US, see farmdoc daily, January 15, 2020).
Thus, for Brazil, the stocks component of the balance sheet encompasses greater uncertainty. However, ending stocks must follow a fundamental law of storable commodity markets: stocks cannot fall below zero. In practice, measured stocks never truly reach zero; some amount remains in the supply chain at some location even in situations of extreme shortage. These are so-called ‘pipeline’ stocks.
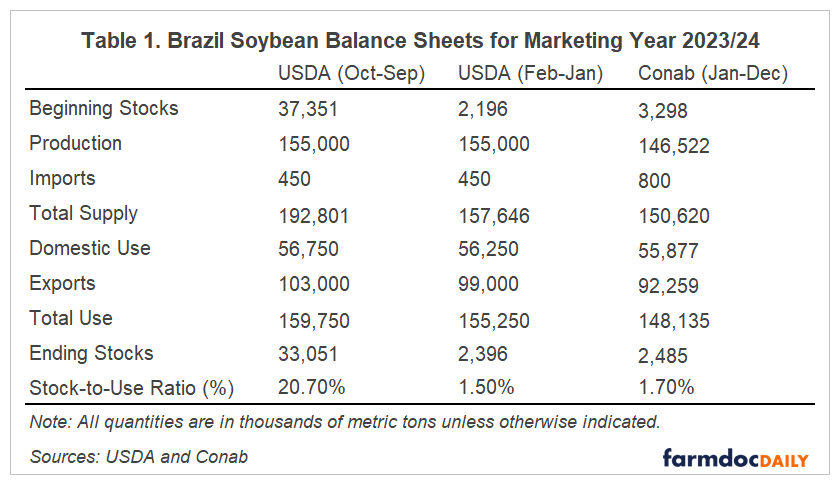
We compare estimates of balance sheet quantities – production, use, and stocks – from USDA and Conab. USDA prepares two Brazil balance sheets. One uses USDA’s global soybean marketing year which runs from October to September and is presented in USDA’s monthly WASDE report. The other uses a February to January marketing year similar to the January to December marketing year used by Conab. The production estimate is always the same for both USDA balance sheets. What differs between the USDA balance sheets is use and stocks.
Current marketing year balance sheets are shown in Table 1. USDA ending stocks for the October to September marketing year are much higher the February to January one because the latter begins just as Brazil is starting its soybean harvest. Current ending stocks estimates from USDA and Conab for similar marketing year period are roughly the same. Given that the USDA production number exceeds Conab, its use estimates are also higher.
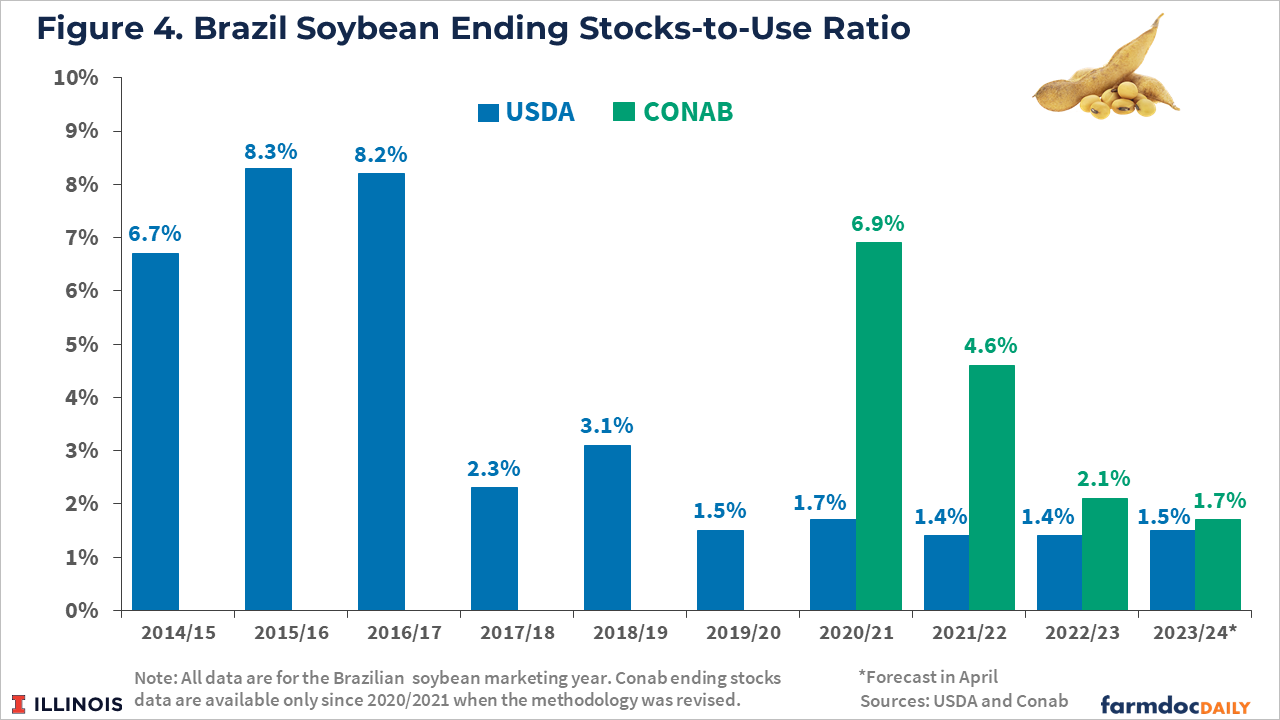
Current Brazil soybean ending stocks levels are near pipeline levels according to both USDA and Conab. The stocks-to-use ratio is 1.5% according to USDA and 1.7% according to Conab, extremely low compared to historic estimates. However, USDA’s stocks-to-use ratio has been at pipeline levels since 2019/20, whereas Conab only reached this level in the current marketing year (see Figure 4). When ending stocks are up against the near-zero lower bound, production decreases must result in use decreases and use increases must result in production increases.
If USDA wishes to follow Conab and other private forecasters who believe Brazil soybean production is less than 155 million metric tons, it must find corresponding decreases in use. According to USDA, the use data it reviews suggest this cannot be the case, so its production number must remain higher (see for example commentary in the February 2024 WASDE report.) In comparison, Conab has not had to address the near-zero lower bound on stocks in their soybean balance sheet until now.
Some private analysts are also reckoning with discrepancies between production and use estimates for Brazilian soybeans. Agroconsult is a private Brazilian consultancy that has recently raised its forecast for the 2023/24 soybean crop to 156.5 million tons (5.75 billion bushels), very close to that of USDA. Using its own novel methods to assess planted area, Agroconsult has said soybean farmers planted 46.4 million hectares (114.6 million acres) this season. That is 1.2 million hectares (2.9 million acres) more than projected by Conab and 500 thousand hectares (1.2 million acres) more than USDA’s estimate. After surveying fields in 15 Brazilian states and considering that the weather differed by region, Agroconsult’s yield estimate is the same as the USDA (see Rally da Safra, 2024).
Final Considerations
While USDA often uses official statistics from foreign statistical agencies in its global supply and demand estimates, USDA may also develop its own estimates to reconcile the balance between production, use, and inventories. In the case of Brazil soybean production, USDA has provided estimates substantially higher than those of the official Brazilian government agency, Conab. Higher production estimates are necessary to reconcile USDA’s world soybean balance sheet with its chosen estimates for use and the near-zero lower bound on estimated soybean inventories. Conab is nearing a similar situation given its own ending stocks estimate for 2023/24. This implies the necessity of a major re-think in how these agencies develop their estimates and a possible revision in past estimates that may create some volatility in soybean markets. However, projecting the timing and nature of this reckoning is difficult.
A consensus soybean production estimate for Brazil would alleviate some of the current uncertainty about the global soybean supply and demand balance. However, the presence of government supply and demand estimates, even very accurate ones, has never stopped traders and analysts from disagreeing in the past. Nor has it eliminated the possibility that crop conditions and expected production levels will continue to change over the growing season. Based on the relatively limited upward movement in soybean prices over the past six months, many analysts are suggesting the cash and futures markets are trading USDA’s Brazil production data for now.
References
Braun, K. “Can Analysts Out-Predict USDA, Conab on Brazil Crop Forecasts?” Reuters, April 11, 2024. https://www.reuters.com/markets/commodities/can-analysts-out-predict-usda-conab-brazil-crop-forecasts-2024-04-11
Conab, National Supply Company. Crops Time Series. Soybean Production. Brasília, Brazil. April 2024. https://www.conab.gov.br/info-agro/safras/serie-historica-das-safras
Irwin, S. "Did That Really Just Happen? USDA Revisions to the 2018/19 Corn Balance Sheet." farmdoc daily (10):7, Department of Agricultural and Consumer Economics, University of Illinois at Urbana-Champaign, January 15, 2020.
Rally da Safra, 2024. “Fechamento Etapa Soja – Perspectivas para a Safra de Soja 2023/24.” Agroconsult, March 28, 2024. https://rallydasafra.com.br/e-book-gratuito-fechamento-etapa-soja-perspectivas-para-a-safra-de-soja-2023-24/
Siqueira, D. “What is Brazil’s Soybean and Corn Production Size?” Ohio’s Country Journal, February 20, 2024. https://ocj.com/2024/02/what-is-brazils-soybean-and-corn-production-size/
USDA, U.S. Department of Agriculture. World Agricultural Supply and Demand Estimates (WASDE). April 2024. https://www.usda.gov/oce/commodity/wasde
Vaclavik, J. “Is USDA Lying About Brazil?? (Corn and Soybean Production)”. Grain Markets and Other Stuff, April 12, 2024. https://www.youtube.com/watch?v=_7Vws8XYUvk
Disclaimer: We request all readers, electronic media and others follow our citation guidelines when re-posting articles from farmdoc daily. Guidelines are available here. The farmdoc daily website falls under University of Illinois copyright and intellectual property rights. For a detailed statement, please see the University of Illinois Copyright Information and Policies here.


