Further Evidence on the Impact of Late Planting on the U.S. Average Corn Yield
The latest Crop Progress report from the USDA showed that 27 percent of U.S. corn acreage was planted as of April 28, 2024. This is five percentage points above the average for this date over 2019-2023. However, wet conditions in many parts of the Corn Belt have slowed planting progress, with more rainfall in the forecast for the next 10 to 14 days. Concerns have emerged that the wet conditions will lead to more than the normal amount of corn planted late, which may in turn reduce yield prospects. These concerns are not without merit. For example, a recent farmdoc daily article (October 9, 2023) used a crop weather model to show that the variation in the amount of late planting from year-to-year is the third most important variable in explaining the U.S. average corn yield, trailing only July precipitation and temperature. The purpose of today’s article is to use the same crop weather model to provide further evidence on the impact of late planting on the U.S. average corn yield. A complete listing of previous farmdoc daily articles related to late corn planting can be found here.
Analysis
We begin by reviewing the “Thompson-style” crop weather regression model that was used in the October 9th farmdoc daily article to relate the U.S. average corn yield to a time trend, the percentage of the crop planted late, and an array of weather variables. The updated version of the model estimated here uses data from 1980 through 2023 and includes the following explanatory variables: i) a linear time trend variable to represent technological change, ii) the percentage of the corn crop planted late, iii) linear functions of preseason (September-March), April, and August precipitation, iv) quadratic functions of June and July precipitation, and v) linear functions of April, May, June, July, and August temperatures. The cutoff date for late planting is based on agronomic field trials relating planting date to corn yields at the farm-level (e.g., farmdoc daily article, April 25, 2018), which indicate that yield penalties become increasingly large as planting is delayed after mid-May. Consequently, we define the beginning date for substantial late planting penalties on corn yield in the U.S. to be May 30th from 1980 through 1985 and May 20th from 1986 onwards. The change in cutoff dates in the mid-1980s reflects recommendations for earlier planting that appeared around that time. Complete details on the model specification can be found in the October 9th article.
The monthly weather data are collected for 10 key corn-producing states (Iowa, Illinois, Indiana, Minnesota, Missouri, Nebraska, North Dakota, Ohio, South Dakota, and Wisconsin). These 10 states typically accounted for about 75-80 percent of total U.S harvested acreage of corn during the sample period. An aggregate measure for the 10 states was constructed using harvested corn acres to weight state-specific observations. The weighted-average monthly weather variables are used to represent weather observations for the entire U.S. corn crop. Precipitation data are monthly totals and temperature data are monthly averages. The National Weather Service is the source for the weather data via the Midwest Regional Climate Center.
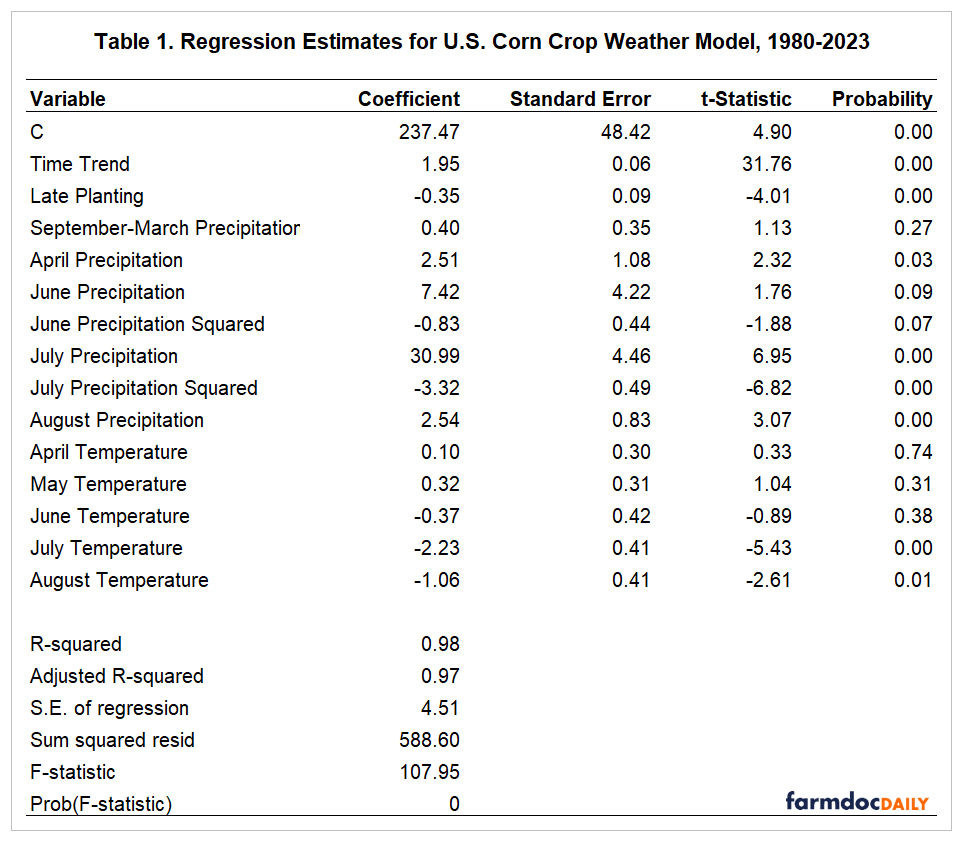
Table 1 presents the regression estimates for the crop weather model. While there are certainly many other specifications that could be considered, the crop weather model explains 98 percent of the variability in the U.S. average yield of corn, and therefore captures the most important factors that drive yield at this level of aggregation. The signs of the coefficient estimates are as expected. The time trend coefficient indicates that the trend rate of growth in the U.S. average corn yield over this time period was slightly less than two bushels per year. The crop weather variables are statistically significant at the ten percent level or better except for pre-season precipitation and April-June temperature.
The model estimates found in Table 1 indicate that for each percentage of the U.S. corn crop planted late the U.S. average corn yield is reduced by 0.35 bushels per acre. This implies that a 10 percent increase in late planting decreases the U.S. average corn yield by 3.5 bushels per acre. A previous farmdoc daily article (April 28, 2022) on late planting estimated that a 10 percent increase in late planting decreases the U.S. average corn yield by a smaller amount, about 2 bushels per acre. Since the exact same measure of late corn planting is used to estimate both impacts, the difference can be attributed to the different regression models used in each article. The 2-bushel estimate is based on a two-variable regression model where the only independent variable is late planting. In contrast, the 3.5-bushel estimate is based on a multivariate regression model that simultaneously estimates the impact of late planting and other important crop weather variables. The multivariate regression model generally is superior, in the sense of producing more unbiased statistical estimates, so it is reasonable to place higher confidence in the 3.5-bushel estimate of late planting impact.
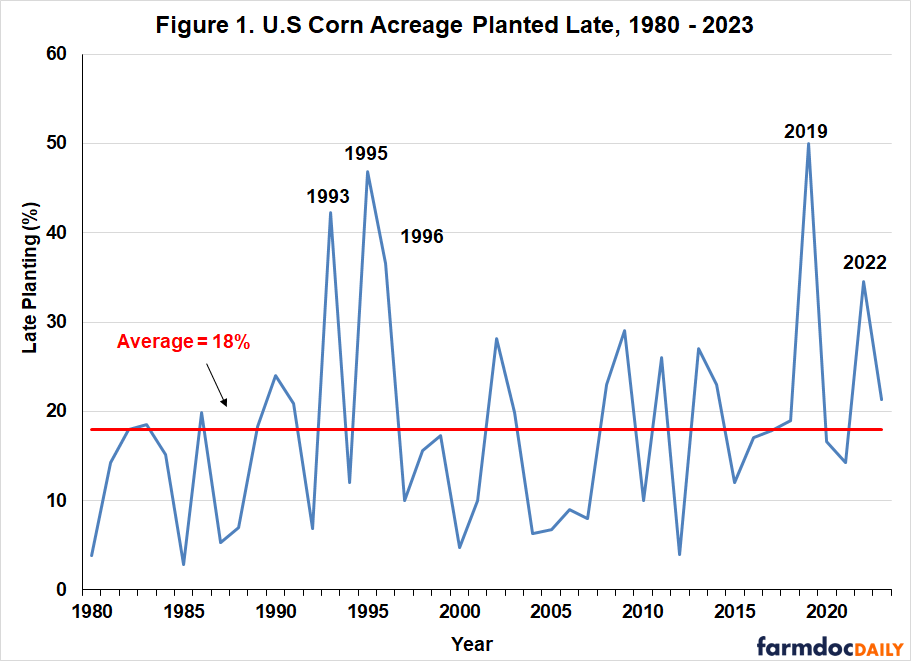
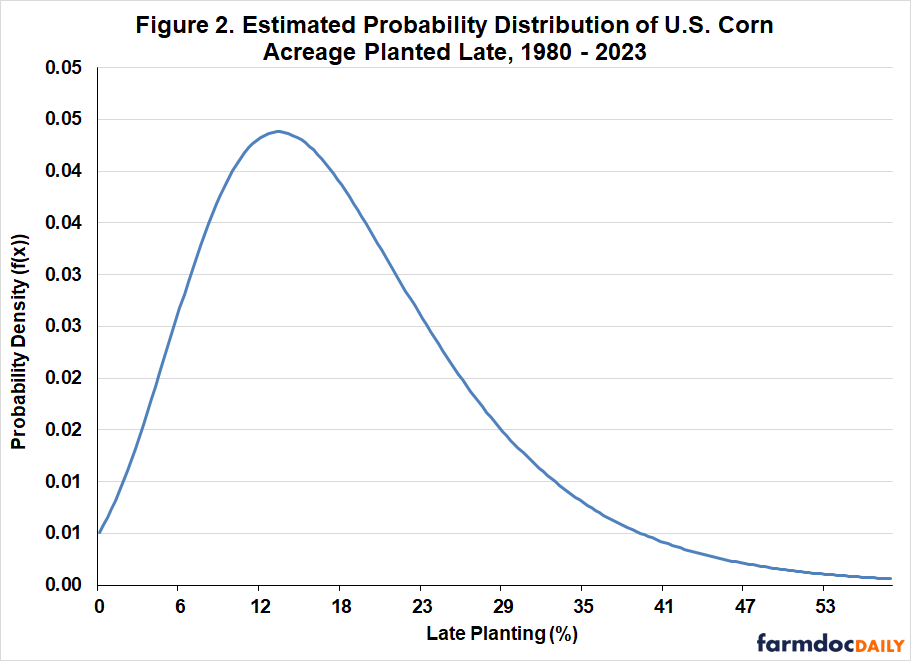
When projecting late planting impacts, it is important to be aware of a unique characteristic of late planting variables constructed in the manner used here. This is apparent in Figure 1, which shows the percentage of corn acreage planted late in the U.S. based on the above definition over 1980 through 2023. On average, late planting was 18 percent, with the bulk of the observations between about 5 and 25 percent. Five years stand out with extraordinarily high levels of late planting, 1993, 1995, 1996, 2019, and 2022. Late planting in these five years ranged from about 35 to 50 percent. If one excludes these five years, the average level of late planting drops to 14.9 percent. As shown in Figure 2, the existence of these few but very large instances of late planting results in a distribution that is highly skewed to the right. By contrast, the other crop weather variables included in the regression model are much closer to normal “bell-shaped” distributions.
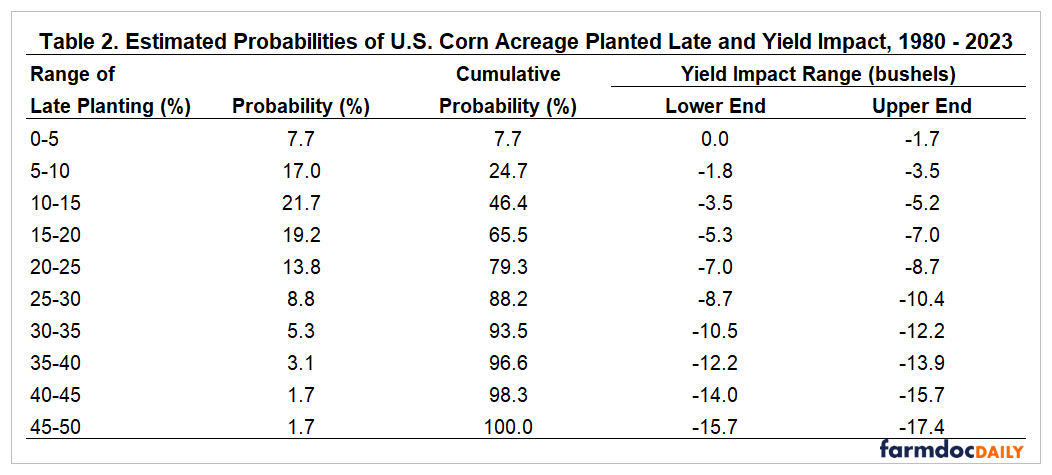
We can estimate probabilities for ranges of late planting by computing the area under the distribution curve shown in Figure 2. The results of these computations are presented in Table 2. Notice how the historical probabilities are large for relatively low levels of late planting while they are very low for relatively high levels. For example, the probability of late planting between 0 and 20 percent is nearly 66 percent, whereas the probability of late planting between 30 and 50 percent is less than 12 percent. The chance of a repeat of late planting near the record late planting level of 50 percent in 2019 is exceedingly small, less than 2 percent.
Table 2 also contains estimated impacts on the U.S. average corn yield for each of the late planting ranges. This yield impacts are computed as each end of the late planting range times the estimated late planting coefficient (-0.35) from the crop weather model in Table 1. In this way, the probability of the yield impact of the ranges of late planting can be computed. Note that the estimated yield impact is negative for any non-zero level of late planting by construction. For perspective, the yield impact at the average level of late planting, 18 percent, is -6.3 bushels per acre. The historical probability of yield losses much greater than this is relatively low, less than about one-third, due to the highly skewed nature of the distribution of late planting.
Of obvious interest at the present time is the possible impact of late planting in 2024 on the U.S. average yield of corn. The logical starting point is the projected trend yield for corn using the crop weather model presented in Table 1. Computing the trend yield component for the linear variables in the model, such as late planting, involves simply inputting the sample average over 1980 through 2023 for the variable. The procedure is more complicated for non-linear variables like July precipitation. The result is a projected U.S. average trend yield for 2024 of 182.1 bushels per acre. This trend yield projection assumes that late planting in 2024 will be at the historical average of 18 percent.
What if late planting is higher than the historical average, which may be the case this year if the present wet weather pattern continues? The computation is relatively straightforward. If, for example, one believes that late planting will be 10 percent above average, or 28 percent, then simply multiply 10 percent times the coefficient on late planting in Table 1, -0.35 percent, which is -3.5 bushels. Next, subtract this amount from the projected trend yield to obtain the new projection of 182.1 – 3.5 = 178.6 bushels per acre. One can repeat this type of calculation for any level of late planting that differs from the historical average. It is important to remember that if one starts with trend yield then subtract only the late planting impact relative to average late planting because the trend yield projection assumes average late planting.
Implications
Timely planting of the U.S. corn crop is a perennial question. The purpose of this article is to use a crop weather model to provide further evidence on the impact of late planting on the U.S. average corn yield. We define the beginning date for substantial late planting penalties on corn yield in the U.S. to be May 30th from 1980 through 1985 and May 20th from 1986 onwards. The crop weather model indicates that for each percentage of the U.S. corn crop planted late the U.S. average corn yield is reduced by 0.35 bushels per acre. This implies that a 10 percent increase in late planting decreases the U.S. average corn yield by 3.5 bushels per acre. When projecting late planting impacts, it is important to be aware of a unique characteristic of late planting variables constructed in the manner used here. There are a few years with extraordinarily high levels of late planting (1993, 1995, 1996, 2019, and 2022) and this results in a distribution that is highly skewed to the right. Consequently, the historical probability of late planting between 0 and 20 percent is nearly 66 percent, whereas the probability of late planting between 30 and 50 percent is less than 12 percent. As the rest of the 2024 planting season unfolds, trend yield projections can be easily adjusted using the late planting estimates presented in this article.
References
Irwin, S. "The Relative Impact of Crop Weather Variables on the U.S. Average Yield of Corn." farmdoc daily (13):184, Department of Agricultural and Consumer Economics, University of Illinois at Urbana-Champaign, October 9, 2023.
Irwin, S. "What Do We Know About the Impact of Late Planting on the U.S. Average Corn Yield?" farmdoc daily (12):59, Department of Agricultural and Consumer Economics, University of Illinois at Urbana-Champaign, April 28, 2022.
Irwin, S. and T. Hubbs. "Prospects for Timely Planting of the 2018 Corn Crop." farmdoc daily (8):74, Department of Agricultural and Consumer Economics, University of Illinois at Urbana-Champaign, April 25, 2018.
Disclaimer: We request all readers, electronic media and others follow our citation guidelines when re-posting articles from farmdoc daily. Guidelines are available here. The farmdoc daily website falls under University of Illinois copyright and intellectual property rights. For a detailed statement, please see the University of Illinois Copyright Information and Policies here.


