


Are Changes in Cost of Production and Statutory Reference Prices Related in the House Agriculture Committee 2024 Farm Bill?
Between 2014, when current statutory reference prices were first implemented, and 2024; the economic cost of production per trend output unit has increased +15% on average for the nine crops for which this cost is calculated by USDA, ERS (US Department of Agriculture, Economic Research Service). The House Agriculture Committee Farm Bill of May 24, 2024 increases statutory reference prices for the nine crops by +14% on average. While the average percent increase in costs and reference prices is similar, the relationship between these two percent changes is limited for individual crops. For example, statutory references prices are increased +10% for barley and +14% for seed cotton even though their economic cost of production per trend output unit is lower in 2024 than 2014. The increase in cost thus has limited ability to explain and therefore justify the mix of changes in individual crop statutory reference prices in the House Agriculture Committee Farm Bill, particularly since the proposed reference prices vary widely relative to the 2024 cost to produce individual crops.
Economic Cost per Trend Output Unit, 2024 vs. 2014
Economic cost per trend output unit takes into account changes in both economic cost per acre and increases in yield over time, which has been a feature of US agriculture since the late 1930s. The economic cost per acre calculated by USDA, ERS was converted to an economic cost per trend output unit by dividing it by an estimate of US trend yield. Trend yield was estimated using a linear trendline regression for the 1974/75 through 2023/24 crop years. The data used and regressions estimated are discussed in the data section at the end of this article. Table 1 in the data section contains the data, including trend yield estimates, economic costs per acre and output unit, and current and proposed statutory reference prices. The increases in trend yield between 2014 and 2024 range from +4% for sorghum to +12% for corn.
While economic cost per acre is higher for all nine cost of production crops in 2024 than in 2014, increases in trend yield results in economic cost per trend output unit being -3% lower in 2024 for barley and seed cotton (see Figure 1). For the other seven crops, economic cost per trend output unit is higher in 2024. Percent increase by crop is +33% (oats), +30% (sorghum), +22% (wheat), +19% (soybeans), +14% (peanuts), +13% (corn), and +8% (long grain rice). The crops in Figure 1 are ordered from highest to lowest percent increase in economic cost per trend output unit.

Comparison
The Farm Bill passed by the House Agriculture Committee last Friday increased the statutory reference price for each of the nine cost of production crops. The range was +10% (barley) to +21% (long grain rice) (see Figure 2). The percent increase in statutory reference price for an individual crop bears limited relationship to the percent change in the crop’s economic cost of production per trend output unit between 2014 and 2024. Sorghum and oats have the largest percent increase in economic cost per unit but some of the smallest percent increases in statutory reference prices. Long grain rice has the largest percent increase in statutory reference price but the third smallest percent increase in economic cost per trend output unit. Statutory references prices for barley and seed cotton are increased double digits even though their economic cost per trend output unit has declined.

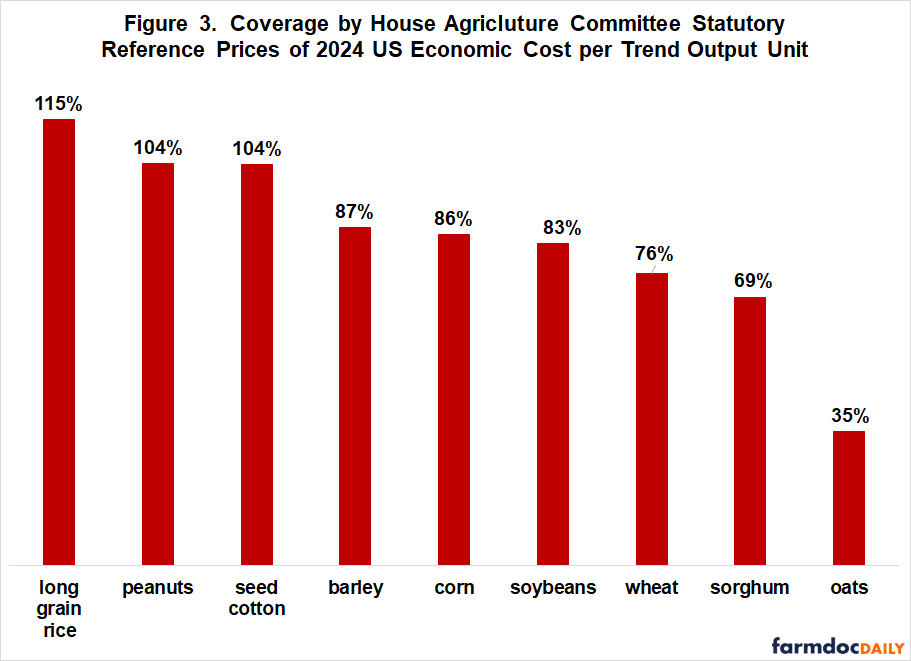
Coverage of 2024 Economic Cost
The ratio of statutory reference price to economic cost per trend output unit is a measure of the degree to which the statutory reference price is a measure of relative support by crop. Support by the House Agriculture Committee Farm Bill statutory reference prices is relatively lowest for oats (35%), then sorghum (69%} and relatively highest for long grain rice (115%), then peanuts and seed cotton (104%) (see Figure 3). The ratios for corn and soybeans is 86% and 83%.
Discussion
The relevant cost when assessing support prices is cost per trend output unit because it includes the impact of increasing trend yields, a feature of US crop production for the last 80 years.
Cost per trend unit of output can decline even when cost per acre is increasing if the increase in yield is large enough. This happened for barley and seed cotton between the 2014 crop year, when statutory reference prices were first instituted, and the current 2024 crop year.
Average percent increase in statutory reference prices in the House Agriculture Committee Farm Bill is similar to average percent increase in economic cost of production per trend output unit.
However, the relationship exists between these two percent changes for individual crops is limited.
The preceding point implies that increasing cost of production has limited ability to explain and thus to justify the mix of changes in statutory reference prices in the House Agriculture Committee Farm Bill.
The proposed statutory reference prices in the House Agriculture Committee Farm Bill will also result in a wide range of support across crops. Three crops have support that exceeds 100% (long grain rice, peanuts, and seed cotton). Two crops have support that is less than 70% (sorghum and oats).
Since future increases in yield are likely, cost per output unit will decrease unless prices and/or quantity of inputs increase more than yield. Adopting higher reference prices in anticipation of higher or sustained high cost of production could revisit the mistake of the 1981 Farm Bill. It increased support prices in anticipation of future increases in cost that did not materialize. Large government spending and major farm policy changes ensued (see farmdoc daily, July 6, 2022 for a more in-depth discussion of the legacy of the 1981 Farm Bill).
Data and Analysis
USDA, ERS (Economic Research Service) reports an economic cost to produce barley, corn, cotton, oats, peanuts, rice, sorghum, soybeans, and wheat. ERS economic cost include operating costs, such as seed and fertilizer, and allocated overhead cost, such as equipment, taxes, and insurance. ERS also assigns unpaid labor and farmer-owned land an opportunity cost. Only management is not assigned a cost. Quantity of each input is based on periodic surveys of farms. Price of each input is updated annually using USDA, NASS (National Agriculture Statistical Service) data. We think ERS costs are reasonable estimates of the cost to produce a crop in the US, but encourage readers to examine the extended discussion of ERS cost estimates in Zulauf, Langemeier, and Schnitkey (2020) and form their own opinion.
The economic cost for 2024 is a preliminary estimate. They are available only for the US and are an average for all types of a crop. The cost for long grain rice is derived using the US all rice cost for 2024 ($1,355.47/acre) times 90.7%, the ratio of average per acre cost for Arkansas non-Delta, Gulf Coast, and Mississippi River Delta regions to the US all rice average per acre cost for the 2023 crop.
Yields per harvested acre used to estimate trend yields are from QuickStats, a data base maintained by USDA, NASS. Change in yield over time is similar for harvested and planted acres. A linear time trend explained the following share of year-to-year variation in US yield per harvested acre over the 1974-2023 crop years by crop: barley (80%); corn (87%), seed cotton (71%), oats (56%), peanuts (71%), rice (95%), sorghum (13%), soybeans (89%), and wheat (81%).
Source for the statutory reference prices is USDA, FSA (Farm Service Agency). A statutory reference price was not authorized for seed cotton until the 2018 Farm Bill. This reference price is used for 2014. The other reference prices in Table 1 were the same in the 2014 and 2018 Farm Bills. The reference price for rice is for long grain rice, the most common type in the US.

References and Data Sources
House Committee on Agriculture, Chairman Representative Glenn “GT” Thompson. May 27, 2024. Farm Bill: Certainty for All Farmers. https://agriculture.house.gov/uploadedfiles/detailed_summary_final.pdf
US Department of Agriculture, Economic Research Service. May 2024. Cost of Production. https://www.ers.usda.gov/data-products/commodity-costs-and-returns/
U.S. Department of Agriculture, Farm Service Agency. May 2024. ARC/PLC Program Data. https://www.fsa.usda.gov/programs-and-services/arcplc_program/arcplc-program-data/index
US Department of Agriculture, National Agricultural Statistics Service. May 2024. QuickStats. http://quickstats.nass.U.S.da.gov/
Zulauf, C., M. Langemeier, and G. Schnitkey. 2022. U.S. Crop Profitability and Farm Safety Net Payments since 1975. Journal of the American Society of Farm Managers and Rural Appraisers. Pages 60-69. https://www.asfmra.org/resources/asfmra-journal
Zulauf, C., G. Schnitkey, K. Swanson, J. Coppess and N. Paulson. “2024 Farm Bill Dilemma, 1981 Farm Bill, and 2018 Farm Bill Price Support Adjustments.” farmdoc daily (12):101, Department of Agricultural and Consumer Economics, University of Illinois at Urbana-Champaign, July 6, 2022.
Disclaimer: We request all readers, electronic media and others follow our citation guidelines when re-posting articles from farmdoc daily. Guidelines are available here. The farmdoc daily website falls under University of Illinois copyright and intellectual property rights. For a detailed statement, please see the University of Illinois Copyright Information and Policies here.