


Estimates of Corn Production and Yields Based on 6/30/2024 Crop Conditions
This article estimates corn yields for the 18 leading corn states and then calculates total corn production and average national corn yield using the recently released NASS crop acre estimates. Based on the 6/30/24 crop condition report (week 26), total corn production is estimated to be 15.0 billion bushels with a range from 14.6 billion to 15.4 billion bushels. The national corn yield is estimated to be 179.7 bu/ac with a range from 174.8 to 184.6 bu/ac.
Introduction
Starting in June, the USDA collects weekly crop conditions from all the leading corn states. Some states have earlier estimates though. These estimates continue until harvest. The crop is rated as either: very poor, poor, fair, good, or excellent. These estimates are reported on Monday afternoons based on reports collected from the prior weekend. With only a few days between reporting and publication, this is some of the most current data available from the USDA. There are crop condition reports going back to 1986.
These weekly crop reports have been used with varying degrees of success to predict both state crop yields and harvested acres. Ibendahl (2022 and 2023) has used the data to predict state and national wheat, corn, and soybean yields, acres, and total grain production. As might be expected, the accuracy of the predictions increases as the growing season progresses. The first few weeks of crop reports have very low predictive power, and this report is no different. Irwin and Good (2017), using a different model of crop conditions, reported similar predictive accuracy early in the growing season.
Even though the predictive power of the crop report model is low at this point, especially for the northern states, it is improving. This article demonstrates how the model works and provides an estimate of corn yields, harvested acres, and total production from the 18 leading corn states. This model is based on the NASS estimate of harvested acres from June 28th USDA-NASS Acreage Report. Corn yields are estimated from the June 30th USDA-NASS Crop Condition Report following the procedure described below. The results include the expected corn production from each state as well as the confidence interval for that estimate. To produce an estimate of corn production, the estimated yield for each state is multiplied by the NASS estimate of state harvested acres. The model presented here is unique as a national corn estimate is based on predicting each state’s corn yield per acre from a 30-year timeline of data from a specific week during the year. The individual state estimates are then combined into a national estimate.
Procedure
As described earlier in Ibendahl (2022 and 2023), the Bain and Fortenbery model uses all five of the crop condition values in the construction of an index (CCIndex).
Because the crop conditions are mutually exclusive, the sum of the percent of acres across the five categories must total to 100 percent. Thus, possible index values range from 100 (if all the crop acres are excellent) down to 0 (if all the crop acres are very poor). A value of 50 would indicate the average crop condition for the state is in fair condition. The USDA provides data at the state level but not at the crop reporting district level nor at the county level.
In this analysis, the crop condition report for a specific week is used to construct a CCI index for the last 30 years (the same week from each of the 30 years). The crop conditions from the week of June 30th are used in the model reported here (week 26). These CCIndexes are then used in a regression analysis to estimate the deviation from trend line corn yield in each state. Each state is estimated individually and the yield per acre confidence interval for each state is also calculated. Because the yield estimate is based on a specific week, the model must be rerun for each week of the growing season. That is, an analysis of the crop growing conditions next week will produce a different set of parameters than the current week as the CCIndex changes from week to week for both the current and historical years.
Results
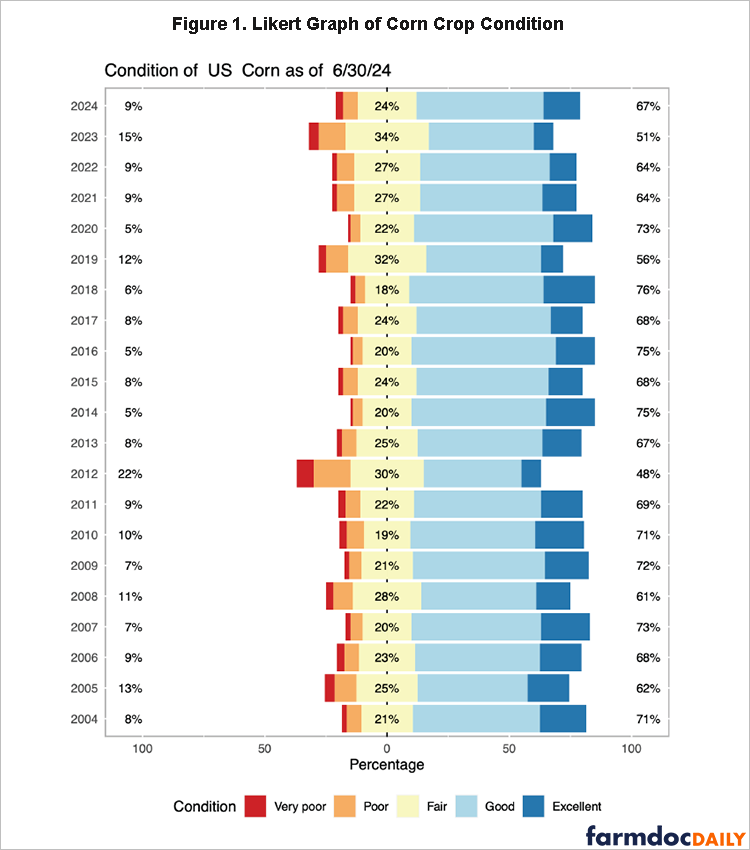
Figure 1 is a Likert graph of the corn crop conditions for the last 20 years in the U.S. The Likert graph is centered on the fair category to make comparisons among years easier. The number along the left-hand-side of the figure is the total of the very poor and poor categories while the number along the right-hand-side is the total of the good and excellent categories. The Likert graph shown in Figure 1 indicates that corn over the last 20 years looks remarkably similar the last week of June. Corn so far in 2024 looks a little better than last year and almost identical to 2022.
Figures 2, 3, and 4 show the estimated yield per harvested acre, the estimated harvested acres, and the total production for each of the 18 leading corn states. As mentioned above, the fit of the model in most states is still improving at this point. The model is basically giving a trend line estimate for yield with wide confidence intervals. The harvested acre estimate comes directly from the USDA-NASS estimate from the June 28, 2024 Acreage report.
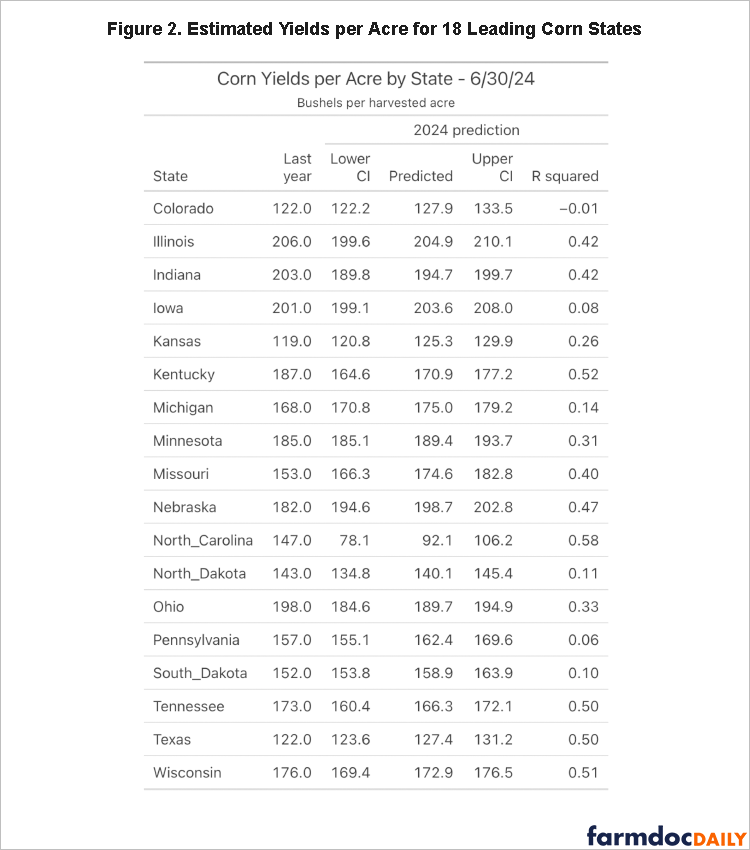
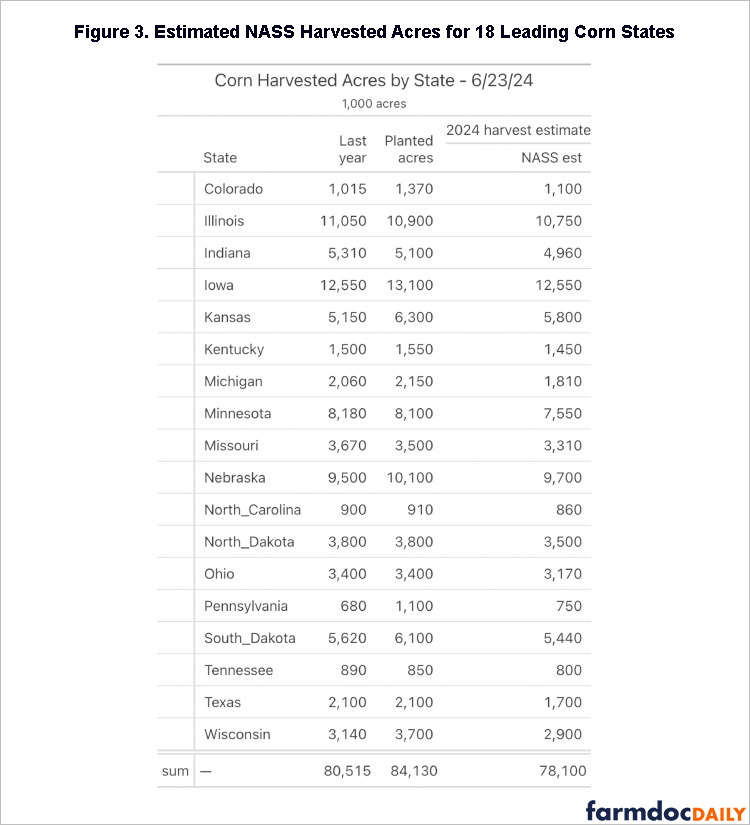
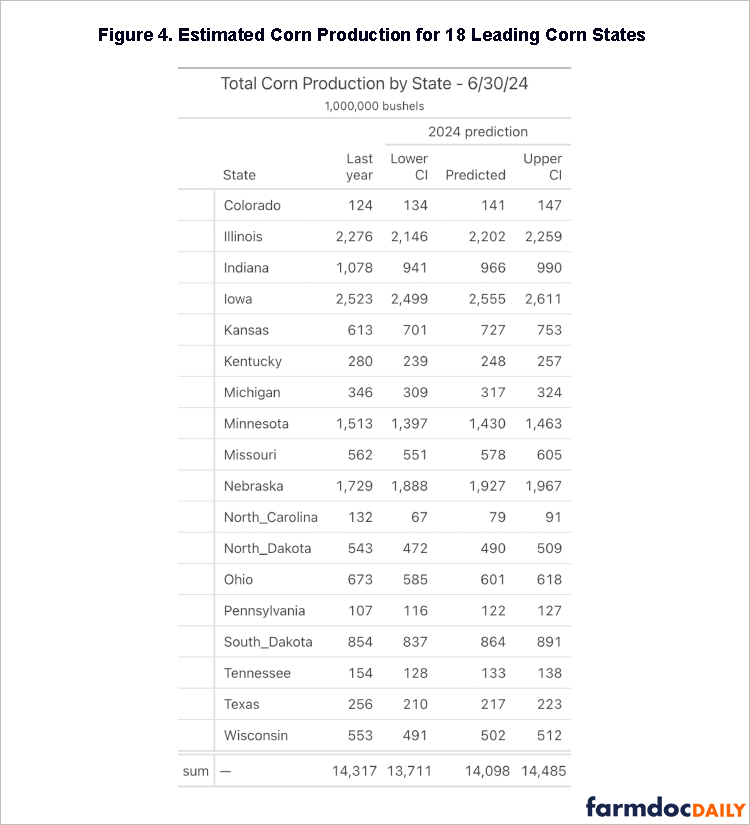
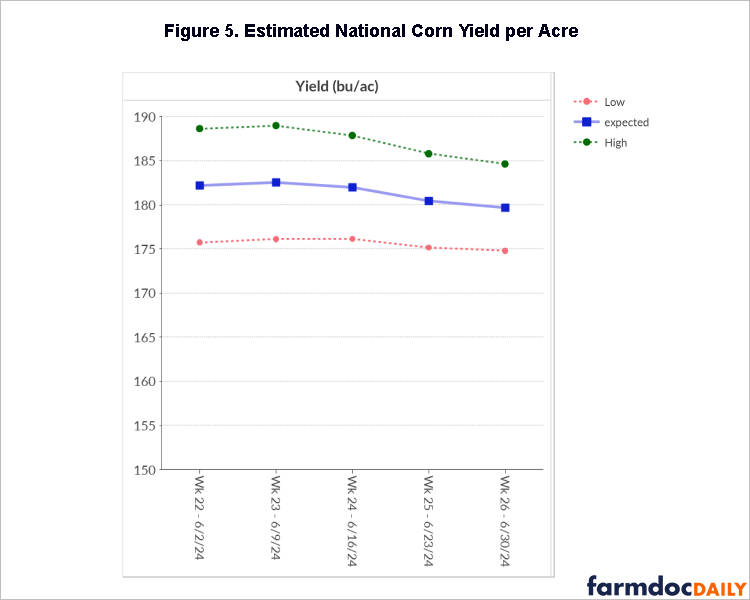
Figure 5 projects a national yield per acre for each week with a crop condition report. Because the yield per acre from the individual states can’t be summed together, the shown yield per acre is calculated from the total production divided by the total harvested acres. Total U.S. corn production is calculated by adjusting the production from the 18 leading corn states upward based on the historic relationship between U.S. production and the production from the 18 leading corn states. As calculated, total U.S. corn production is estimated to be 14.99 billion bushels with a range from 14.58 billion to 15.40 billion bushels. The national corn yield is estimated to be 179.7 bu/ac with a range from 174.8 to 184.6 bu/ac.
Concluding Thoughts
It is still early in the growing season. Readers should expect changes to the estimates as the season progresses and perhaps even significant changes depending on the amount of rain received over the growing season. Also, as noted by Irwin and Good, the earliest estimates probably tend to overestimate yields. Readers should interpret these results as production that could occur during a normal growing season.
References
Bain, R. and T. R. Fortenbery. 2013. “Impacts of Crop Conditions Reports on National and Local Wheat Markets.” Proceedings of the NCCC-134 Conference on Applied Commodity Price Analysis, Forecasting, and Market Risk Management. St. Louis, MO. http://www.farmdoc.illinois.edu/nccc134
Ibendahl, G. "An Estimate of Corn Production From the 18 Leading Corn States." farmdoc daily (12):111, Department of Agricultural and Consumer Economics, University of Illinois at Urbana-Champaign, July 27, 2022.
Ibendahl, G. "An Estimate of Winter Wheat Production." farmdoc daily (13):97, Department of Agricultural and Consumer Economics, University of Illinois at Urbana-Champaign, May 26, 2023.
Irwin, S. and D. Good. "When Should We Start Paying Attention to Crop Condition Ratings for Corn and Soybeans?" farmdoc daily (7):96, Department of Agricultural and Consumer Economics, University of Illinois at Urbana-Champaign, May 24, 2017.
Disclaimer: We request all readers, electronic media and others follow our citation guidelines when re-posting articles from farmdoc daily. Guidelines are available here. The farmdoc daily website falls under University of Illinois copyright and intellectual property rights. For a detailed statement, please see the University of Illinois Copyright Information and Policies here.