


US Federal Debt, Interest Outlays, and the Farm Safety Net
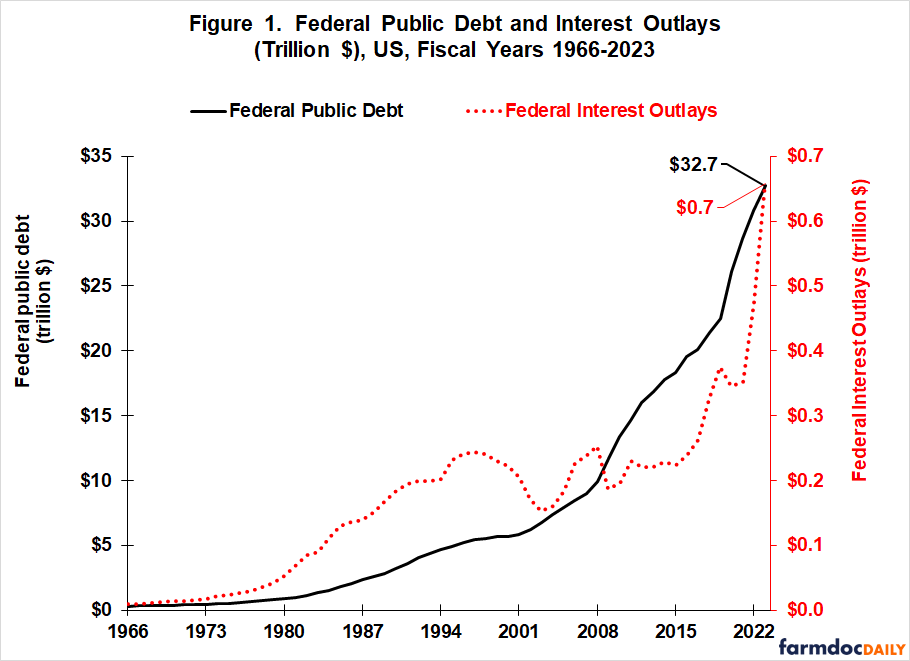
It is hard to comprehend the size of the $28 trillion US economy and $6 trillion US Federal budget. One approach to help wrap your head around these huge numbers is to use ratios in historical context. This approach is used to examine the large increase in US Federal Government debt since the financial crisis of 2008 and in Federal interest outlays (i.e. spending) since 2020 (see Figure 1). Ratios reveal the increases are not nearly as dramatic as Figure 1 implies, but the ratios of Federal interest payments to Federal spending and gross domestic product (GDP) have increased enough to be at levels that have not been sustained historically. Debate is likely to intensify over what is the appropriate share of current government spending to devote to interest paid on past government spending. The debate will focus on interest rate decisions of the Federal Reserve and on how, and by how much to, reduce Federal deficits. The likelihood of this debate intensifying will encourage forward progress on the farm bill as it raises the potential for future cuts in farm safety net spending.
Federal Interest as a Share of Federal Spending
The Federal debt attracts attention, but interest on the debt is arguably more important to monitor. Not only is it a claim on current tax revenue, but it must be paid or else the credit rating of the US will be downgraded. The US would then have to pay higher interest rates and thus spend even more on interest.
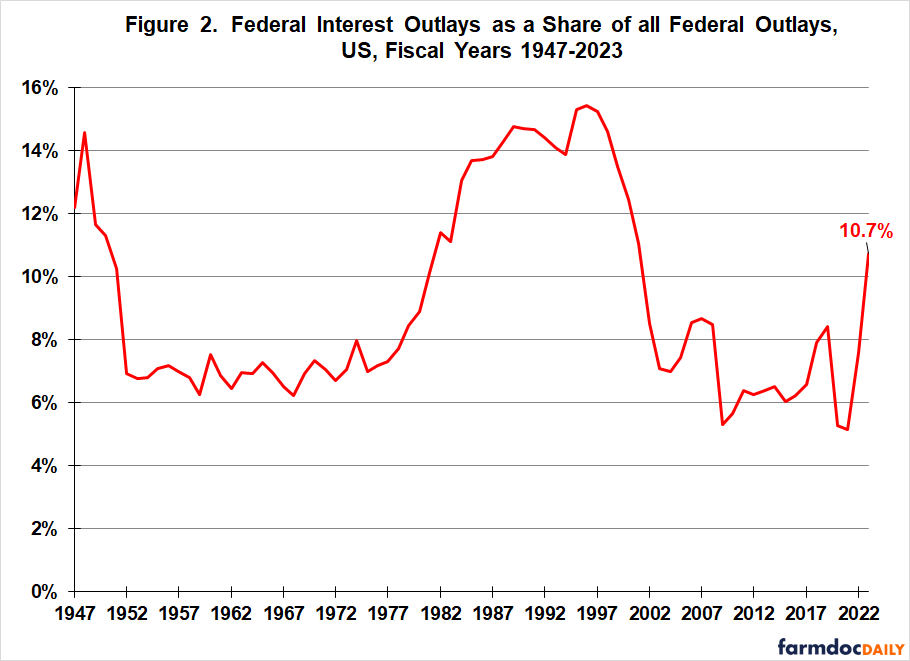
Reflecting its large dollar increase since 2021 (see Figure 1), interest payments on the Federal debt as a share of all Federal outlays jumped from 5.2% to 10.7% (see Figure 2). This share is still well below the highest share of 15.4% in Fiscal Year 1996. However, Figure 2 reveals that the US has not historically sustained a double-digit ratio of current spending on past spending (i.e. interest on the Federal debt). After each of the two periods since World War II when the share was double digits (1947-1951 and 1981-2001), the US reverted to a period with a ratio between 6% and 8% on average. Historical perspective thus suggests the debate over what share of current Federal spending should be devoted to past Federal spending is likely to intensify. The US may decide that it is willing to accept a higher share than in the past, but historical perspective suggests the share will eventually decline, although it does not offer much insight on how long a double-digit share will last. It could be many years. The data for Figures 1 and 2 as well as the other figures in this article come from FRED (Federal Reserve Economic Data), which is maintained by the St. Louis Federal Reserve.
Federal Interest as a Share of GDP
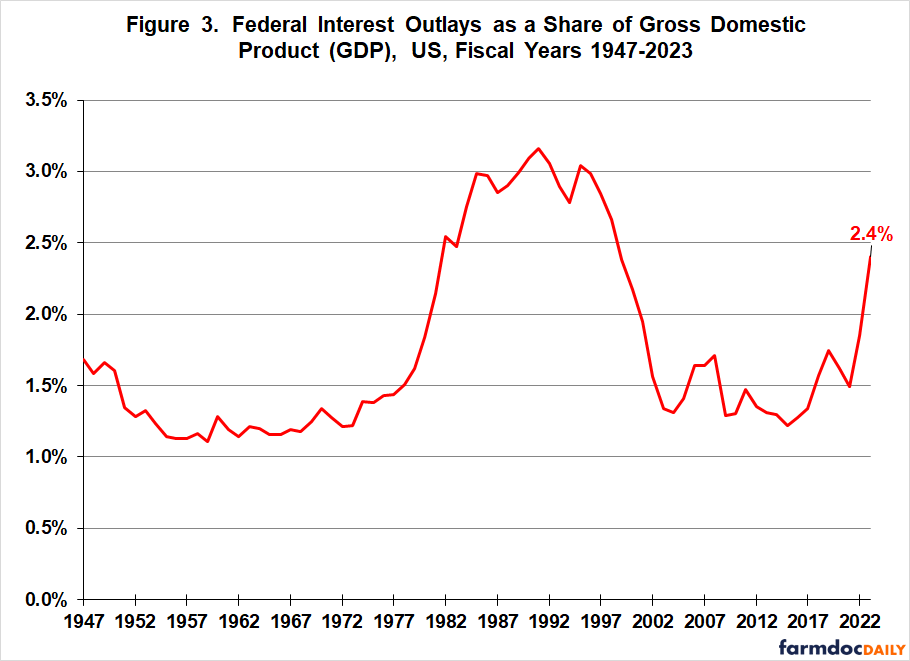
A similar historical perspective emerges if Federal interest outlays are expressed as a share of GDP (see Figure 3). The share jumped from 1.5% in Fiscal Year 2021 to 2.4% in Fiscal Year 2023. The share also exceeded 2% from 1981 to 2002, with a peak of 3.2% in Fiscal Year 1991. If this period is excluded, Federal interest outlays have averaged 1.4% of GDP.
Relative Size of Federal Spending
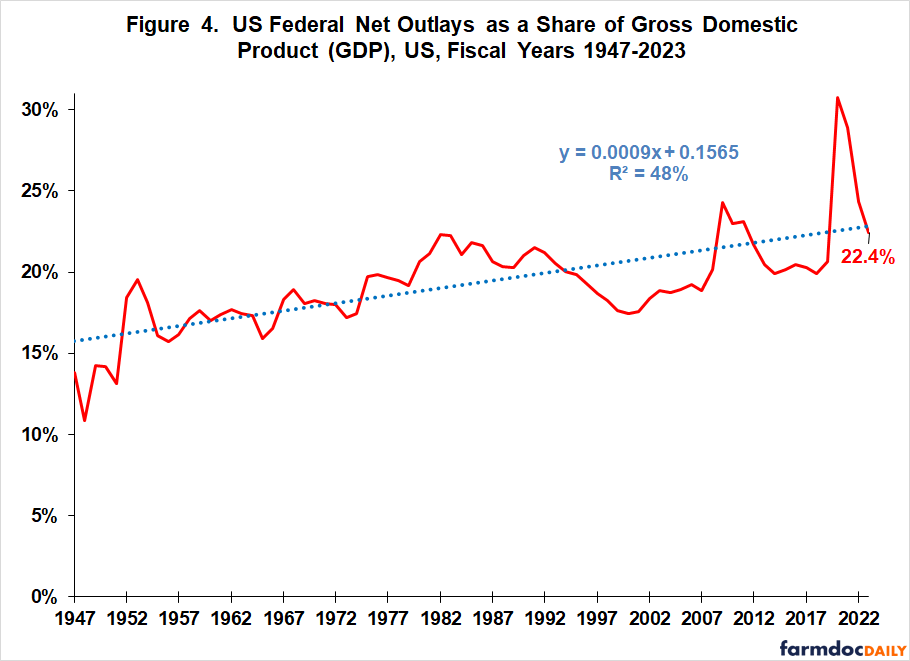
While not the only determinants of Federal interest outlays, the three major ones are interest rates and previous tax revenue and government spending. Given this perspective, it is notable that Federal spending in Fiscal Year 2023 was 22.4% of GDP, a share almost exactly equal to its post-World War II time-trend value (see Figure 4). The share has trended slightly but statistically significantly upward at the rate of 0.09 percentage point per year. The 2023 ratio does not remove Federal spending as a likely focal point in the upcoming debate, but it does temper the argument that Federal spending is the only culprit.
Discussion
Large increases have occurred in US Federal Government debt since the financial crisis of 2008 and in Federal interest outlays since 2016 and especially 2020.
While the ratios of US interest payments to total Federal spending and GDP increase less dramatically than the nominal expenditures, the two ratios have reached levels that historically the US has not been willing to sustain.
Debate is likely to intensify over what is the appropriate share of current government spending to devote to past government spending through interest payments on the Federal debt. This debate will focus on interest rates set by the Federal Reserve, and on future Federal deficits, thus the roles of tax revenue and Federal spending. In the July 10, 2024 farmdoc daily, we noted the large negative government savings (i.e. Federal deficits) as a share of GDP during the financial and COVID crises that have pushed up the national debt.
The likelihood of this debate intensifying will encourage forward progress on the farm bill as it raises the potential for constraints and even cuts in farm safety net spending.
Even if a farm bill is completed in 2024, farmers and other beneficiaries of the bill will find it in their long term fiscal interest to plan for future cuts in legislated support and to identify areas in which they are willing to accept cuts. History and common political sense tells us that it will be hard to reduce the growth in spending on national defense, Social Security, and medical care. The Farm Bill is not part of this triumvirate.
On a more positive note, because the US is currently not that far into the range of interest payment ratios that it historically has not been willing to sustain, historical experience also suggests that relatively small adjustments to interest rates or taxes or Federal spending occurring soon can address the concern with relatively minimal disruption when stretched over several years. Adjustments are likely to become larger and thus more disruptive if action is deferred.
Data Source and Reference
Federal Reserve Bank of St. Louis. June 2021. Federal Reserve Economic Data (FRED). https://fred.stlouisfed.org
Zulauf, C., D. Orden and G. Schnitkey. “US Interest Rates and the Price of Capital.” farmdoc daily (14):127, Department of Agricultural and Consumer Economics, University of Illinois at Urbana-Champaign, July 10, 2024.
Disclaimer: We request all readers, electronic media and others follow our citation guidelines when re-posting articles from farmdoc daily. Guidelines are available here. The farmdoc daily website falls under University of Illinois copyright and intellectual property rights. For a detailed statement, please see the University of Illinois Copyright Information and Policies here.