Performance of SCO and ECO in the Midwest
Supplemental Coverage Option (SCO) is a county-level insurance product that adds a band of coverage over the underlying COMBO crop insurance product up to an 86% coverage level. Enhanced Coverage Option (ECO) provides an additional band from 86% up to either 90% or 95% coverage again based on the county-wide outcome. This article evaluates SCO and ECO for non-irrigated corn and soybeans in the Midwest states from 2015 to 2023. If purchased each year, results show that SCO and ECO had very low payments relative to premiums, particularly for Illinois, Indiana, Iowa, Ohio, and Wisconsin. Given the loss performance, justifying the use of SCO and ECO to supplement coverage is difficult, particularly in regions with low yield variability.
Policies Compared
SCO and ECO are county-level products available for farmers who purchase COMBO insurance plans (see farmdoc daily, February 27, 2014, April 24, 2014, November 24, 2020). The county coverage offered by SCO and ECO begins at the farm-level coverage selected for the underlying COMBO product. Coverage of SCO and ECO mimics that of the underlying COMBO plan. Because most farmers purchase Revenue Protection (RP), the performance of SCO and ECO is evaluated assuming an underlying purchase of RP, a revenue product whose guarantee increases if the harvest price is above the projected price.
The comparisons are presented for the following policies:
- SCO-70% provides coverage from 86% down to 70%. The “SCO-70%” scenario means that the underlying policy is RP at a 70% coverage level.
- SCO-80% implies that RP is purchased at the 80% coverage level, and SCO’s coverage is thus from 86% to 80%.
- ECO-90% provides a coverage band from 90% down to 86%, again based on the county revenue when RP is selected.
- ECO-95% provides coverage from 95% down to 86%. The ECO-90 and ECO-95 policies represent the two coverage choices under ECO.
ECO extends coverage above that offered by SCO. However, ECO can be used without a SCO purchase. Moreover, unlike SCO, ECO does not have a commodity title requirement. To use SCO, farmers must choose Price Loss Coverage (PLC) as their commodity title choice. Farmers can choose Agriculture Risk Coverage (ARC) as their commodity program and still purchase ECO.
SCO was introduced in 2015, and payments are known through 2023. Each year’s SCO premiums are calculated using the SCO rates for that year, along with the projected price and volatility for that year. ECO was introduced in 2021. ECO premiums in 2015 through 2020 are calculated using 2021 rates using the respective years’ projected prices and volatilities. SCO rates have declined slightly over time, leading to suggestions that ECO premiums may be understated.
Both premiums and payments are calculated given that the Trend-Adjusted Actual Production History (APH) yield on the RP product is the same as the expected yield for the county-level products. The protection level for both SCO and ECO is 1.0.
SCO-70% Results for Non-irrigated Corn
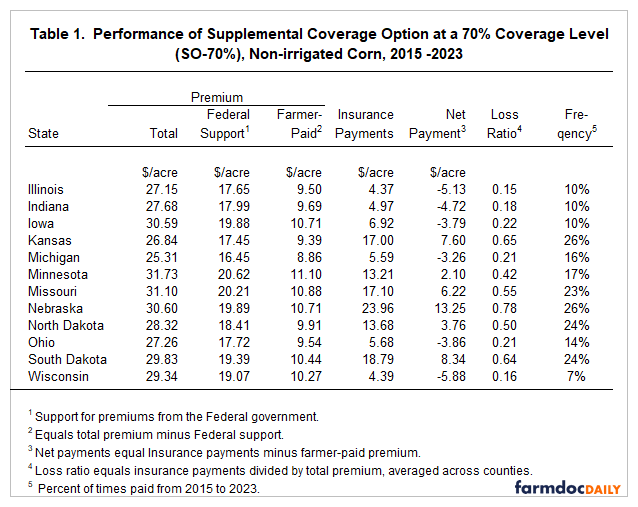
Table 1 shows the performance of SCO-70%, averaged across all counties for Midwestern states. As shown in the table, the total premium for Illinois averaged $27.15 per acre. The Risk Management Agency (RMA) is tasked with developing total premiums that are actuarially fair with a small loss reserve. As a result, insurance payments for SCO and ECO should be slightly lower than total premiums over time.
Farmers do not pay the total premium, as Federal support is provided to offset part of total premium costs, thereby encouraging use. Federal support equals 65% of the total premium for SCO policies. For Illinois, Federal support averaged $17.65 per acre. The farmer-paid premium thus equals $9.50 per acre ($27.15 total premium – $17.65 Federal support).
From 2015 to 2023, payments from SCO-70% averaged $4.37 per acre for Illinois. The frequency of payments was low, with only 10% of the county-yield combinations receiving payments. Overall, Illinois farmers had an average net payment of -$5.13 per acre, meaning they paid $5.13 more for SCO-70% than they received in insurance payments even after the Federal premium support.
Actuarial performance is often judged by the loss ratio, which equals insurance payments divided by total premiums. The loss ratio for Illinois is extremely low at .15 (see Table 1). Other states with very low loss ratios include Wisconsin (.16) and Indiana (.18). The highest loss ratio for non-irrigated corn is Nebraska at .78, followed by Kansas at .65, and South Dakota at .78. Loss ratios in all Midwest states are well below the target 1.0 loss ratio.
Results for Non-irrigated Corn – SCO-80%, ECO-90%, and ECO-95
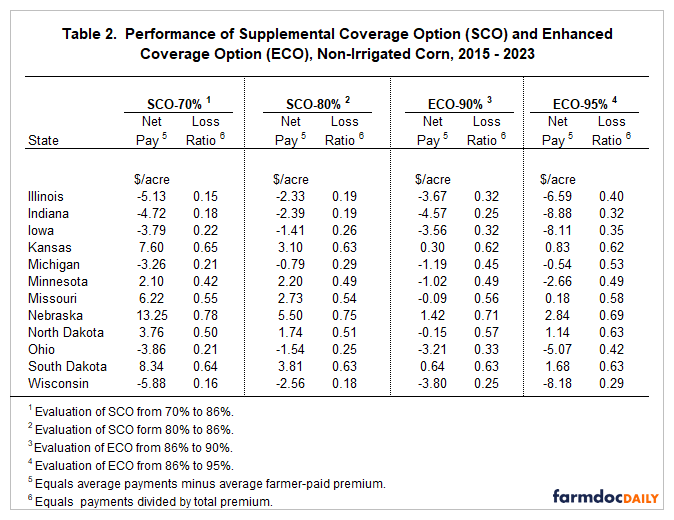
SCO-80%, ECO-90%, and ECO-95% have similar performance to that of SCO-70% (see Table 2). For Illinois, all policies resulted in negative average net payments even after subsidy: -$5.13 per acre for SCO-70%, -$2.33 for SCO-80%, -$3.67 for ECO-90%, and -$6.59 for ECO-95%. Loss ratios also are also low across policies averaging .15 for SCO-70%, .19 for SCO-80%, .32 for ECO-90%, and .40 for ECO-95%. The ECO products have a higher loss ratio than the SCO products, suggesting that those products have more accurate rates. Still, ECO’s loss ratios have been extremely low in the major production regions.
Geographic distributions of county-level net payments for ECO-95% are illustrated by the map shown in Figure 1. Overall, net payments are negative in most counties in Iowa, Wisconsin, Illinois, Indiana, and Ohio. However, even in those states, some counties would have had positive net payments on average since 2015. In Illinois, there are 14 counties with positive net payments. The five counties with the highest net payments are Alexander ($22 per acre), Union ($15), Lake ($11), Knox ($5), and Cook ($5) counties.
Results for Non-irrigated Soybeans
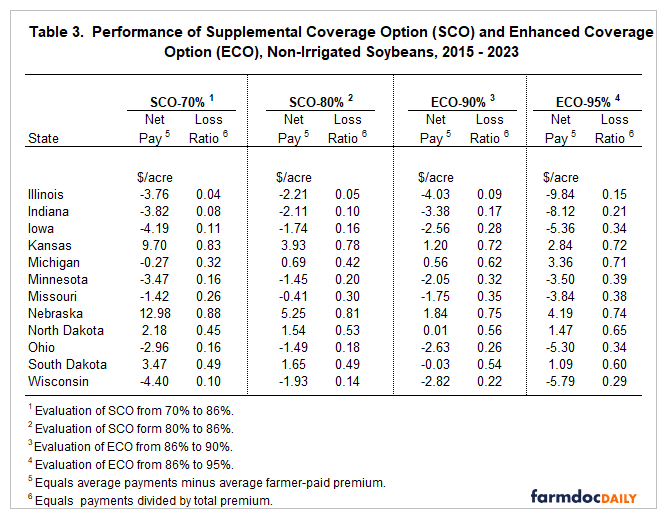
For the I-states of Iowa, Illinois, and Indiana, soybeans have had even lower loss ratios on the supplemental area policies than corn (see Table 3). For Illinois, soybeans have a .04 loss ratio for SCO-70%, compared to a .15 loss ratio for corn. Loss ratios across all products in Illinois are: .04 for SCO-70%, .05 for SCO-80%, .09 for SCO-90%, and .15 for ECO-95%. Indiana and Iowa have similar loss performance. At SCO-70%, Indiana has a .08 loss ratio and Iowa has a .11 loss ratio.
Other Midwestern states had higher average loss ratios but were still below 1.0. Nebraska had a .88 loss ratio for SCO-70%, resulting in a net payment of $12.98 per acre. Similarly, Kansas had a .83 loss ratio and a $9.70 net payment.
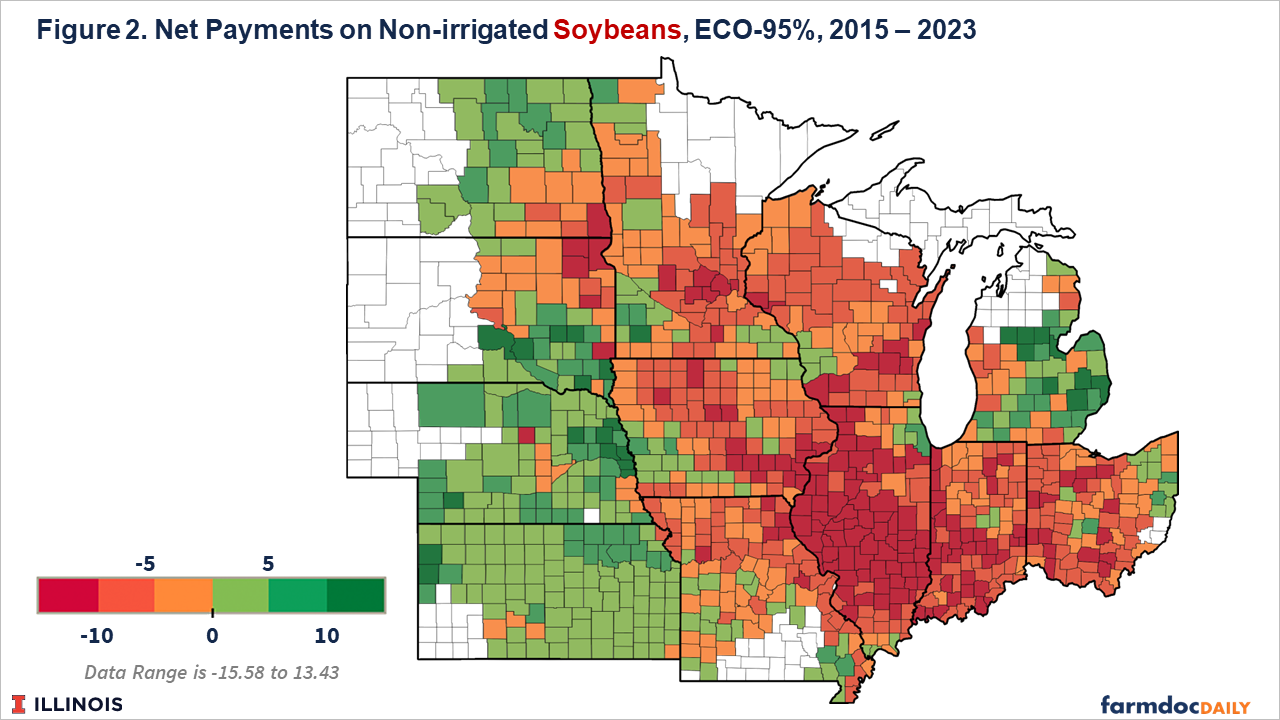
Overall, the geographic distribution of SCO and ECO performance for soybeans follows a pattern similar to corn, with lower loss ratios in areas with higher productivity and lower yield variability (see Figure 2). Compared to corn, a more extensive geographical range of negative net payments existed, beginning in eastern North and South Dakota and continuing through Ohio. Illinois had many counties with low negative payments, and 35 counties would not have generated an ECO-95% payment at all from 2015 to 2023. Net payments were positive in the western Great Plains, an area whose loss ratios were closer to target levels.
Commentary
In the heart of the Corn Belt, SCO and ECO have had very low loss ratios over their relatively short history, resulting in negative net payments to farmers in most counties. Low loss performance makes it more difficult to justify using SCO and ECO. Any risk reduction associated with SCO and ECO must overcome higher costs in terms of negative net payments. It can be argued that the period from 2015 to 2023 was a particularly good period and that losses will eventually “catch up” in the heart of the Corn Belt, but this conjecture is problematic. While a drought like that which occurred in 2012 did not happen from 2015 to 2023, yield disruptions did occur from 2015 to 2023, including wet weather in 2019 and the Iowa derecho in 2020. Moreover, the years 2015 to 2019 were low-income years, and harvest prices were below projected prices in six out of nine years. Justifying SCO and ECO use is easier in Great Plains states. Still, risk reduction will depend on the correlation between own-farm and county yields to generate payments most related to farm-level outcomes.
The low loss performance in the central Corn Belt contrasts with that of cotton STAX, another county program that operates very similarly to SCO and ECO. For 2015 to 2022, cotton STAX has a .94 loss ratio, considerably above that for corn and soybeans in the Midwest, providing cotton farmers with significant positive net payments of $37.47 per acre. (see farmdoc daily, June 13, 2024). Those differences in performance lead to questions about why the performance of SCO and ECO are so low in a relatively good-producing region with low yield risks compared to cotton, which is grown in more risky production areas.
While always important, those ratings issues become more critical as modifications to SCO are being discussed for the next farm bill, including increasing the subsidy rates for SCO and ECO (see farmdoc daily, June 4, 2024). Given current loss performance, modifications to SCO would have minimal benefit to Corn Belt farmers, while other regions and crops would receive substantial additional benefits.
Summary
Since its inception in 2015, SCO has made relatively small payments for corn and soybeans in Midwest states, particularly Iowa, Wisconsin, Illinois, Indiana, and Ohio. Low loss performance makes SCO and ECO use particularly difficult to justify in the heart of the Corn Belt, and raises additional distributional concerns from changing subsidy rate of crop insurance products.
References
Paulson, N. and J. Coppess. "2014 Farm Bill: The Supplemental Coverage Option." farmdoc daily (4):37, Department of Agricultural and Consumer Economics, University of Illinois at Urbana-Champaign, February 27, 2014.
Paulson, N. and J. Coppess. "Further Discussion of the Supplemental Coverage Option." farmdoc daily (4):75, Department of Agricultural and Consumer Economics, University of Illinois at Urbana-Champaign, April 24, 2014.
Paulson, N., G. Schnitkey, K. Swanson and C. Zulauf. "The New Enhanced Coverage Option (ECO) Crop Insurance Program." farmdoc daily (10):203, Department of Agricultural and Consumer Economics, University of Illinois at Urbana-Champaign, November 24, 2020.
Schnitkey, G., B. Sherrick, C. Zulauf, N. Paulson, J. Coppess and J. Baltz. "Farm Bill Proposals to Enhance Supplemental Coverage Option (SCO)." farmdoc daily (14):104, Department of Agricultural and Consumer Economics, University of Illinois at Urbana-Champaign, June 4, 2024.
Schnitkey, G., J. Coppess, N. Paulson, C. Zulauf and B. Sherrick. "Cotton STAX and Modified Supplemental Coverage Option: Concerns with Moving Crop Insurance from Risk Management to Income Support." farmdoc daily (14):111, Department of Agricultural and Consumer Economics, University of Illinois at Urbana-Champaign, June 13, 2024.
Disclaimer: We request all readers, electronic media and others follow our citation guidelines when re-posting articles from farmdoc daily. Guidelines are available here. The farmdoc daily website falls under University of Illinois copyright and intellectual property rights. For a detailed statement, please see the University of Illinois Copyright Information and Policies here.


