


Use of Supplemental Coverage Option by Crop
Current public versions of both the House and Senate farm bills increase the subsidy and coverage levels for SCO (Supplemental Coverage Option) insurance. This article therefore examines the use of SCO for the large acreage field crops of barley, corn, grain sorghum, peanuts, rice, soybeans, and wheat (see Data Note 1). Use of SCO has increased since its implementation in the 2015 crop year. During 2021-2023, use of SCO was relatively highest for peanuts and rice and relatively lowest for corn, soybeans, and grain sorghum. Assuming current use indicates future use, SCO enhancements will likely benefit crops associated with the Southern US relatively more and crops associated with the Midwestern US relatively less. These differential relative benefits are consistent with SCO’s design that (a) makes SCO’s value relatively higher for crops with the lowest individual farm insurance coverage and (b) with its restriction that limits the use of SCO to land enrolled in the PLC (Price Loss Coverage) commodity program.
Background: SCO
SCO is an option to purchase area, usually county, level insurance that covers part of the individual farm insurance deductible. Specifically, SCO covers between 86% and the coverage level elected by the farmer for the underlying individual farm insurance. The House and Senate proposals increase SCO coverage to 90% and 88%, respectively.
SCO’s current subsidy rate is 65%. Both proposals increase the subsidy to 80%.
Eligibility for SCO requires the purchase of individual farm insurance [(Revenue Protection (RP), Revenue Protection with Harvest Price Exclusion (RPHPE), and Yield Protection (YP)].
SCO is not available for acres elected into the ARC (Agricultural Risk Coverage) commodity program.
SCO is yield (revenue) insurance if individual farm insurance is yield (revenue) insurance.
SCO Acres over Time
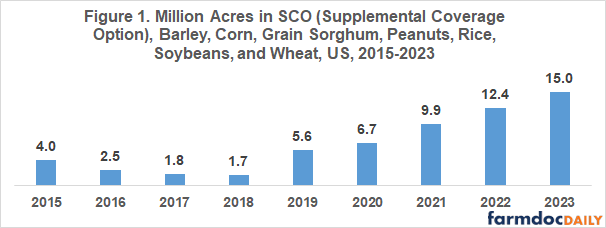
SCO was first available for the 2015 crop year. A total of four million acres was enrolled for the seven crops examined in this article (see Figure 1). In the 2023 crop year, enrolled acres totaled 12 million acres, triple 2015 enrollment. Enrollment has increased steadily since 2018. This and other data used in this article comes from the RMA (Risk Management Agency) Summary of Business data file.
SCO Acres as a Share of Individual Farm Insured Acres by Crop
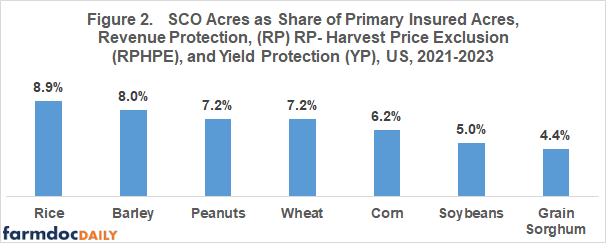
Due to the increase in SCO acres over time, the share of RP, RPHPE, plus YP acres insured in SCO was calculated for the last three years with complete data, the 2021-2023 crop years. SCO acre share ranged from 8.9% for rice to 4.5% for grain sorghum (see Figure 2). Corn and soybean share was 6.2% and 5.0%, respectively.
SCO Liability as a Share of Individual Farm Insured Liability by Crop
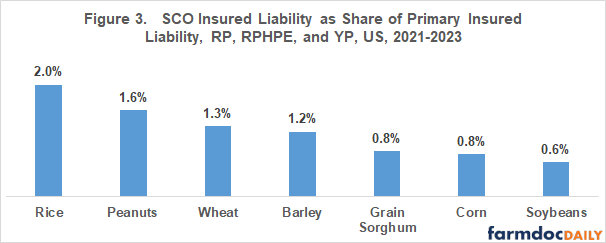
While acres is a commonly used measure of adoption, for SCO the addition to insured liability by purchasing SCO may be more relevant. The reason is that one policy objective of SCO is to allow farmers to buy higher coverage. SCO’s addition to the liability insured with RP, RPHPE, plus YP ranged from 2.0% for rice to 0.6% for soybeans (see Figure 3). The range for liability (three times) was higher than the range for acres: (two times). Rank order of the crops also differed somewhat. For example, soybeans, not grain sorghum, had the lowest SCO liability share; while peanuts, not barley, has the second highest SCO liability share.
Factors Associated with Variation in SCO Use by Crop
Variation in use of SCO by crop, especially when measured using share of liability, is consistent with its restriction to acres enrolled in PLC. Use of PLC is lowest for corn and soybeans and highest for rice and peanuts among the crops in this study (see, for example, enrollment in ARC and PLC for the 2023 crop year (US Department of Agriculture, Farm Service Agency)).
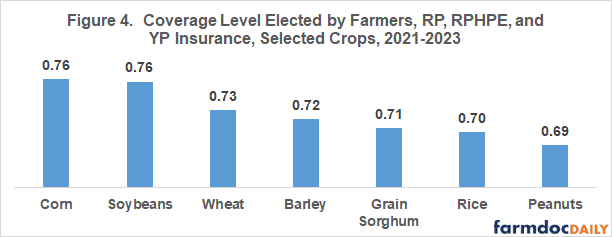
Variation in use of SCO by crop is also consistent with its design to insure the difference between 86% and the individual farm insurance coverage elected by a farmer. SCO’s value is likely highest for crops with the lowest individual farm insurance coverage. Individual farm insurance coverage is highest for corn and soybeans and lowest for rice and peanuts (see Figure 4). The correlation between the values in Figures 3 and 4 is -0.72, which is significant with 93% statistical confidence (-1.0 is perfect negative correlation).
Discussion
Acres insured with SCO have slowly but steadily increased over time, which is consistent with adoption of most new products that gain market share.
Current use of SCO is relatively highest for crops associated with the Southern US (specifically, peanuts and rice) and relatively lowest for crops associated with the Midwestern US (specifically, corn and soybeans). This difference is consistent with SCO’s design to insure the difference between 86% and the coverage level elected for individual farm insurance and the restriction barring SCO for acres enrolled in ARC.
Assuming current use is an indicator of future use, increases in SCO’s subsidy and coverage level will likely have the most relative benefit for crops associated with the Southern US and the least relative benefit for crops associated with the Midwestern US, although both sets of crops will likely increase their use of SCO since farm-paid premiums will be lower.
One option to balance the use of SCO across crops is to remove the restriction barring SCO for acres enrolled in ARC.
Data Note 1
Cotton is not included in this analysis because SCO and STAX (Stacked Income Protection Plan), a cotton only insurance product, have similar but not the same design. SCO’s share of cotton RP, RPHPE, and YP acres was 10% in 2021 and 2% in 2022 and 2023 while STAX’s share was 14% in 2021, 52% in 2022, and 48% in 2023.
References and Data Sources
House Committee on Agriculture, Chairman Representative Glenn “GT” Thompson. May 27, 2024. Farm Bill: Certainty for All Farmers. https://agriculture.house.gov/uploadedfiles/detailed_summary_final.pdf
US Senate Committee on Agriculture, Nutrition, and Forestry. May 21, 2024. The Rural Prosperity and Food Security Act of 2024 Section-by-Section Summary. https://www.agriculture.senate.gov/imo/media/doc/rural_prosperity_and_food_security_section-by-section.pdf
US Department of Agriculture, Farm Service Agency. August 2024. 2023 Program Year Specific Data. https://www.fsa.usda.gov/programs-and-services/arcplc_program/arcplc-program-data/index
US Department of Agriculture, Risk Management Agency. August 2024. Summary of Business. https://www.rma.usda.gov/en/Information-Tools/Summary-of-Business
Disclaimer: We request all readers, electronic media and others follow our citation guidelines when re-posting articles from farmdoc daily. Guidelines are available here. The farmdoc daily website falls under University of Illinois copyright and intellectual property rights. For a detailed statement, please see the University of Illinois Copyright Information and Policies here.