Loss of US Farmland in the 21st Century, Part II: Regional Perspective for Major Land Use Categories from the Census of Agriculture
This article continues the examination of changes in US farmland during the 21st Century that began with the farmdoc daily article of September 18, 2024. Specifically, changes in major farmland use categories are examined by US region between the 1997 and 2022 Censuses of US Agriculture. Land in farms declined in all nine regions used in this article. Pastureland led the decline. The decline in pastureland was likely facilitated by the growth in confinement livestock operations, a reminder that farm sector factors beyond crop returns have important impacts on US farmland. Planted cropland declined in all regions except the Northern Plains and Mid-South. Even though the Midwest planted fewer acres, its share of total farmland planted to crops increased as other farmland was converted to planted cropland. More broadly, specialization occurred in the use of US farmland. The Midwest and regions that extensively border it are specializing in the planting of crops, while the Northeast is specializing in woodland.
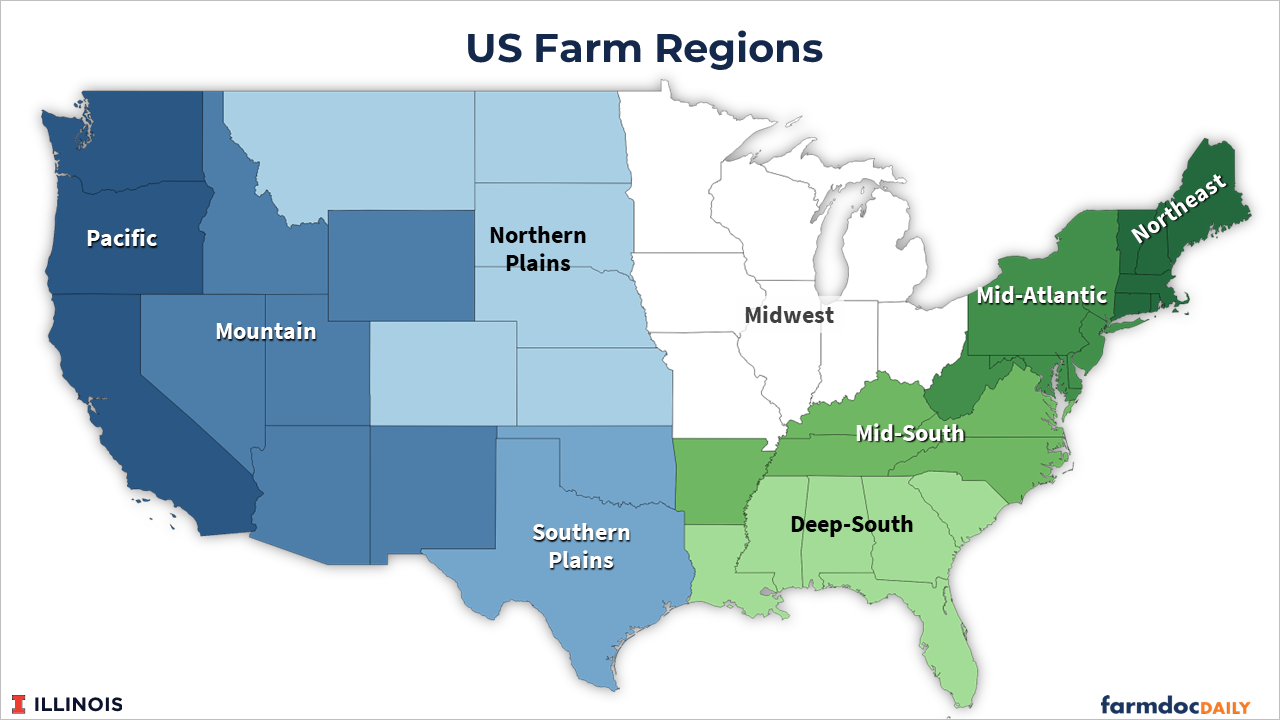
US Farm Regions
The decision on how to divide the US into regions is never easy and always a matter of the issue being examined and the personal choices of a study’s authors. For this study, we decided to use the following regions: Northeast, Mid-Atlantic, Mid-South, Deep South, Midwest, Northern Plains, Southern Plains, Rocky Mountains, and Pacific. The states in each region are listed in Data Note 1, which also contains a map of the Continental US with the regions outlined. Readers may prefer a different breakout, but we think these nine regions reveal important similarities and differences in the US farm landscape of the 21st Century.
Land in Farms, 2022 Agricultural Census
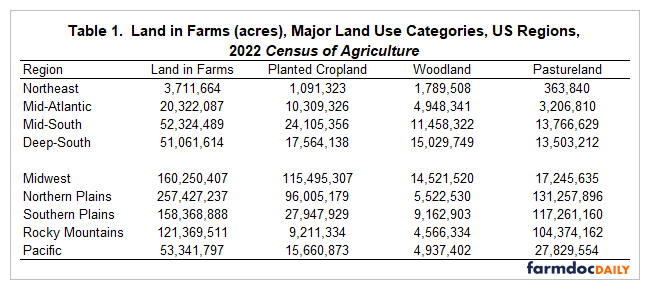
According to the Agricultural Census of 2022, acres in farms by US region ranged from 3.7 million (Northeast) to 257.4 million (Northern Plains) (see Table 1). The Midwest, Southern Plains, and Rocky Mountains regions also had more than 100 million acres of land in farms.
Planted cropland includes cropland that was harvested plus cropland that was abandoned or failed. Woodlands and pastureland overlap since pastureland includes woodlands that are pastured. For the Continental US, 34% of woodlands were pastured in 2022. In 1997, 40% were pastured.
Besides the major land use categories that are the focus of this study, other farmland use categories are (1) land in farmsteads, homes, buildings, livestock facilities, roads, wasteland, etc.; (2) cropland in summer fallow.; and (3) cropland idle or used for cover crops or soil improvement, but not harvested and not pastured or grazed. In 2022, these three land uses accounted for, respectively, 4%, 2%, and 4% of all US land in farms.
Share by Major Land Use Category, 2022 Agricultural Census
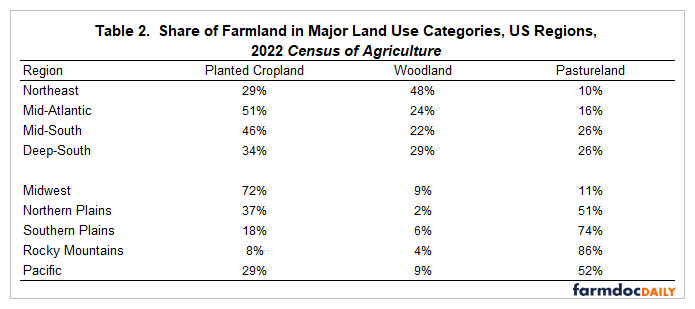
In 2022, the largest use of farmland was woodland in the Northeast (48%); cropland in the Midwest (72%), Mid-Atlantic (51%), Mid-South (46%), and Deep South (34%); and pastureland in the Rocky Mountains (86%), Southern Plains (74%), Pacific (52%), and Northern Plains (51%) (see Table 2). The largest use is dominant as its share exceeds the next largest share by more than 10 percentage points in every region except the Deep South (29% for woodland vs. 34% for planted cropland).
Acre Change by Major Land Use Category from 1997 to 2022
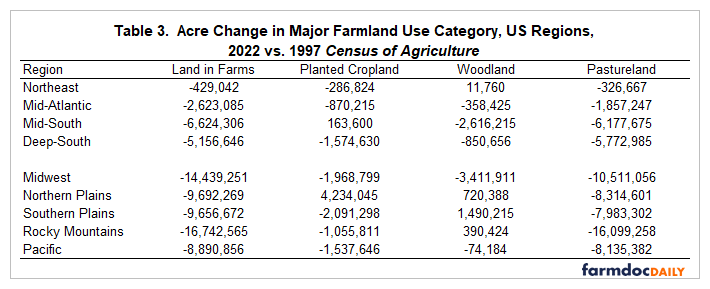
Each region had less farmland in the 2022 Agricultural Census than in the 1997 Agricultural Census (see Table 3). Pastureland declined the most in all nine regions. Planted cropland declined in seven regions. Exceptions were the Northern Plains and Mid-South. Woodland increased in four regions (Southern and Northern Plains, Rocky Mountains, and Northeast) and declined in five regions (Midwest, Mid-South, Deep-South, Mid-Atlantic, and Pacific).
Percent Change in Major Land Use Category from 1997 to 2022
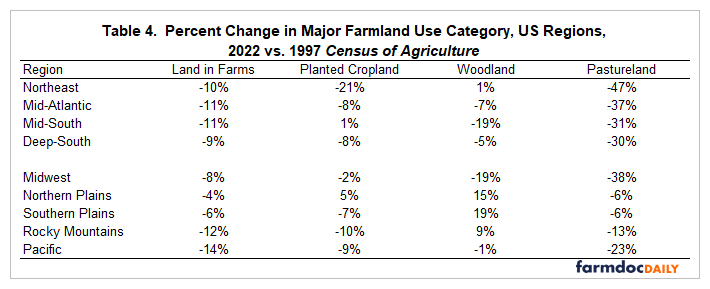
Because acres in farms vary notably by regions, a more complete picture of regional change is gained by examining percent change. Between 1997 and 2022, percent decline in farmland was least in the Northern Plains (-4%) and highest in the Pacific region (-14%) (see Table 4). Double digit percent declines also occurred in the Rocky Mountains, Mid-South, Mid-Atlantic, and Northeast.
Pastureland had the largest percent decline in all regions except the Southern Plains, where planted cropland declined slightly more (-7% vs. -6%). Pastureland’s decline was especially pronounced (30% or more) in regions that include states east of the Mississippi River. Planted cropland declined by at least -7% in all regions except the Northern Plains (+5%), Mid-South (+1%), and Midwest (-2%). In no region did farm woodland have the largest percent decline.
Percentage Point Change in Land Use Shares from 1997 to 2022
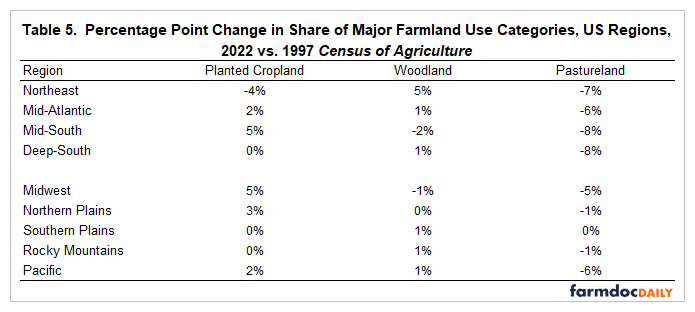
Given the percent changes in farmland use in Table 4, it is not surprising that pastureland’s share of land in farms declined by the most percentage points in eight of the nine US regions between 1997 and 2022, nor that the percentage point decline in pastureland’s share was highest in the regions that include states east of the Mississippi River (see Table 5). On the other hand, woodland’s share changed little except in the Northeast, where it rose by five percentage points. Planted cropland’s share declined only in the Northeast. It did not change in the Deep South, Southern Plains, and Rocky Mountains. It increased in the Midwest and the regions that extensively border it as well as in the Pacific region. Planted cropland’s share increased the most (5 percentage points) in the Mid-South and Midwest.
Discussion
For each of the nine US regions used in this article, land in farms has declined in the 21st Century.
Much has been written and said about the Midwest’s loss of cropland. However, cropland’s share of Midwest farmland and thus its relative importance in the Midwest increased.
Specialization occurred in the use of farmland. The Midwest and regions that have extensive boarders with it, along with the Pacific region, specialized in the planting of crops while the Northeast specialized in woodland.
Pastureland declined the most in all nine regions. This decline was likely facilitated by the growth in confinement livestock operations.
The previous point is a reminder that, while public discussions usually focus on the impact of nonfarm factors, such as urbanization, on the US farm landscape; farm sector factors other than crop returns also have important impacts on the use of US farmland.
Data Note 1: States by Region
Northeast: Connecticut, Maine, Massachusetts, New Hampshire, Rhode Island, and Vermont
Mid-Atlantic: Delaware, Maryland, New Jersey, New York, Pennsylvania, and West Virginia
Mid-South: Arkansas, Kentucky, North Carolina, Tennessee, and Virginia
Deep-South: Alabama, Florida, Georgia, Louisiana, Mississippi, and South Carolina
Midwest: Illinois, Indiana, Iowa, Michigan, Minnesota, Missouri, Ohio, and Wisconsin
Northern Plains: Colorado, Montana, Kansas, Nebraska, North Dakota, and South Dakota
Southern Plains: Oklahoma and Texas
Mountain: Arizona, Idaho, Nevada, New Mexico, Utah, and Wyoming
Pacific: California, Oregon, and Washington
References and Data Source
US Department of Agriculture, National Agricultural Statistics Service. September 2024. 1997 and 2022 Census of Agriculture. https://www.nass.usda.gov/AgCensus/
Zulauf, C., G. Schnitkey, J. Coppess and N. Paulson. “Loss of US Farmland in the 21st Century: The National Perspective from the Census of Agriculture.” farmdoc daily (14):169, Department of Agricultural and Consumer Economics, University of Illinois at Urbana-Champaign, September 18, 2024.
Disclaimer: We request all readers, electronic media and others follow our citation guidelines when re-posting articles from farmdoc daily. Guidelines are available here. The farmdoc daily website falls under University of Illinois copyright and intellectual property rights. For a detailed statement, please see the University of Illinois Copyright Information and Policies here.


