Net Return to Farm Program Crops: Harvest 2024
Concern over low crop prices and high costs is a 2024 farm bill cornerstone issue (farmdoc daily September 26, 2024). A common methodology is used to calculate current and historic net returns from the private market at harvest for large acreage program crops. Cotton and sorghum clearly are disadvantaged among these crops. Support from crop insurance is also examined. It is potentially notable given the decline in prices over the crop insurance period. Failure to consider crop insurance in determining ad hoc assistance will likely result in overlapping payments.
2024 Harvest Private Market Net Return
Net return from the private market at 2024 harvest is calculated: ((crop insurance harvest price times USDA (US Department of Agriculture) US average yield) minus USDA total cost of production) (see Data Note 1). Private market net return at harvest is negative for all farm program crops in this study except temperate Japonica rice (hereafter, Japonica rice) (see Figure 1). Negative net returns vary from -$26/acre for long grain rice to -$205/acre for peanuts. Net return is also below -$100/acre for upland cotton, sorghum, and barley.
10-Year Perspective
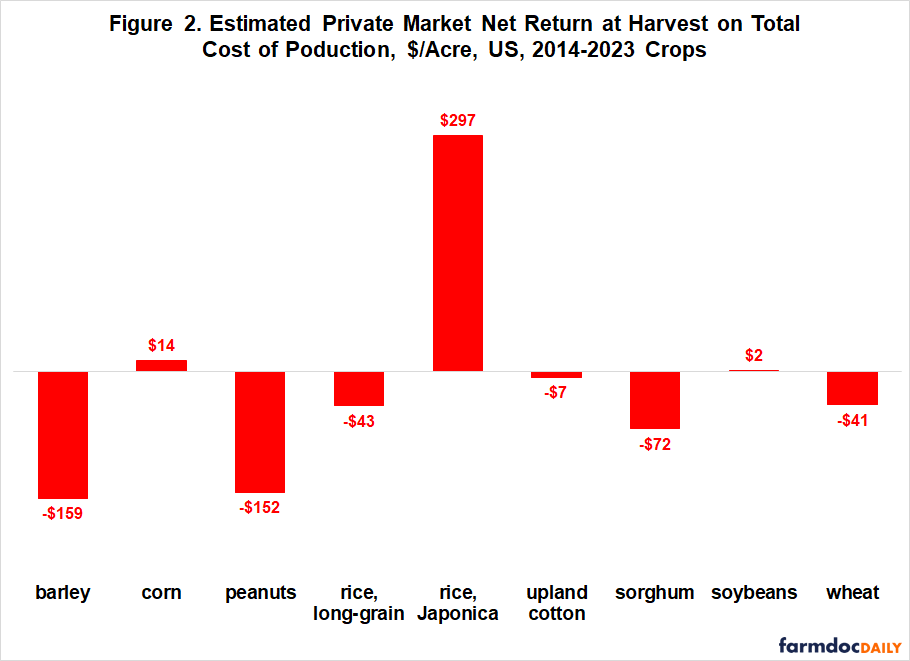
A negative net return can be normal if markets want to discourage using resources to plant a crop. In contrast, markets use a positive net return to encourage using resources to plant a crop. To assess recent market signals, the same net return calculation is made for the prior 10 crop years (i.e., 2014-2023). Average 2014-2023 private market net return per acre at harvest was negative for barley, peanuts, long-grain rice, upland cotton, sorghum, and wheat, but positive for corn, Japonica rice, and soybeans (see Figure 2).
The variation in 2014-2023 net returns implies that 2024 net returns need to be assessed in historic context. For barley, peanuts, sorghum, and wheat; negative 2024 net return is notably less negative when benchmarked against 2014-2023 net return by subtracting 2014-2023 average net return from 2024 net return (see Figure 3). For long-grain rice, benchmarking results in a positive value because 2024 net return is less negative than 2014-2023 net return. For corn and soybeans, benchmarking generates a more negative value because 2014-2023 average net return is positive.
Support from Projected Insurance Price
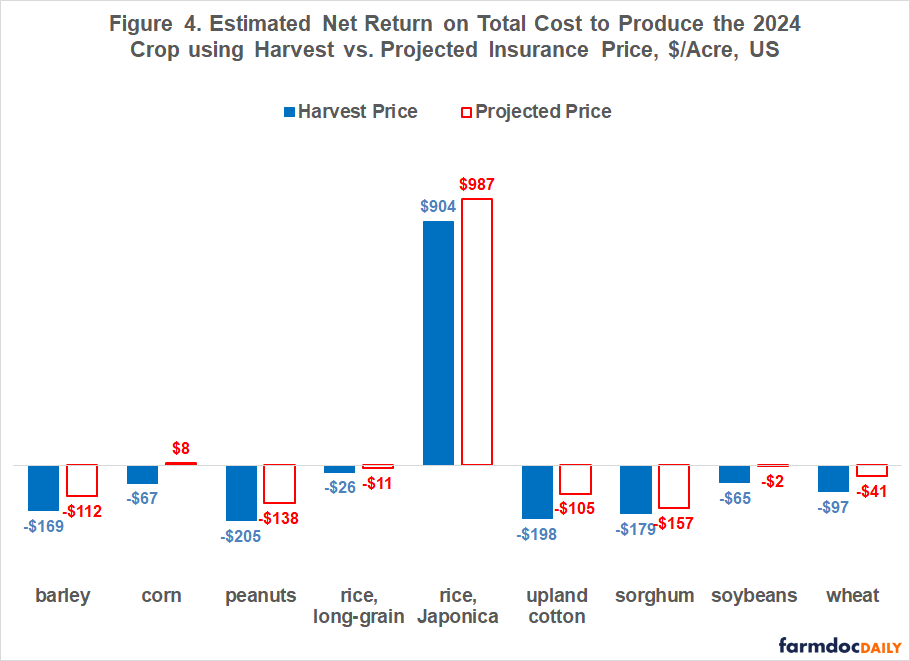
For all crops in this study, the projected insurance price determined prior to planting is higher than the insurance price determined at harvest. The projected insurance price will thus be used to calculate payments by all individual farm and area insurance products for these crops. Using the projected instead of harvest insurance price reduces 2024 losses, often notably (see Figure 4). For barley, corn, upland cotton, soybeans, and wheat, 2024 net return is more than $50/acre higher when using the projected insurance price. For peanuts and sorghum, the increase exceeds $20/acre.
Comparing 2024 net return using the projected insurance price to the average 2013-2024 net return notably reduces the difference between the two net returns for crops with a negative 2024 net return in Figure 1. Only upland cotton and sorghum have a 2024 net return notably more negative than the 2014-2023 average net return at harvest when using the projected insurance price (see Figure 5). Corn and soybeans have a small negative 2024 net return.
Discussion
This article does not pretend that the assessment used in this article is the only potential assessment of the policy question, “Which farm program crops are relatively worse off in 2024?” Calls for ad hoc assistance for the 2024 crop have made this question more important.
This assessment uses a common methodology and data generated by markets and government surveys.
It takes into account recent market returns. Low net returns have different meanings if recent returns are signaling resources to move out of or into production of a crop. Farm policy should be cautious about overriding market signals. Doing so usually result in unsustainable outcomes over time.
Also examined is the potential role of crop insurance, which is likely to be the most important safety net program for the 2024 crop. Good policy should minimize overlap between assistance programs.
Cotton and sorghum are clearly found to be disadvantaged among the large acre program crops in this study.
Assistance from crop insurance in 2024 is also found to be potentially notable for most crops in this study. Failure to consider crop insurance in determining ad hoc assistance will likely result in overlapping payments and thus questionable use of public funds.
Data Note 1
Projected and harvest insurance prices are from USDA, RMA’s (Risk Management Agency) price discovery tool. The prices are specifically for conventional crop practice in the state with the largest or close to largest production of a crop: North Dakota for barley and hard red spring and durum wheat; Illinois for corn, soybeans, and soft red winter wheat; Georgia for peanuts; Arkansas for long-grain rice; California for Japonica rice; Texas for upland cotton; and Kansas for sorghum and hard red winter wheat. The latest insurance sale closing date is used. Harvest insurance prices for 2024 corn, peanuts, Japonica rice, upland cotton, sorghum, and soybeans are currently in discovery. The reported average price as of October 12 is used.
Yield is the final yield per harvested acre for the 2014-2023 crops and latest available yield per harvested acre for the 2024 crops. They are from USDA, National Agricultural Statistical Service’s Quickstats electronic database. Harvested yield is used instead of planted yield because low price is an important component of the current policy discussion. Price is an issue for harvested output.
Economic cost is total economic cost of production per planted acre as estimated by USDA, Economic Research Service (ERS). For 2024 crops, cost is a preliminary estimate available only for the US in total. Cost for long grain rice is derived using the US all rice cost for 2024 ($1,259.20/acre) times 90.7%, the ratio of average per acre cost for Arkansas non-Delta, Gulf Coast, and Mississippi River Delta regions to the US all rice average per acre cost for the 2023 crop. In general, long grain rice is produced in the US except for California, which mostly produces Japonica rice and is the fourth rice production region. ERS economic cost includes operating costs, such as seed and fertilizer; allocated overhead costs, such as equipment, taxes, and insurance; and an opportunity cost assigned by ERS to unpaid labor and farmer-owned land. The only input not assigned a cost is management.
A computational issue arises due to the different varieties of wheat. Insurance products are specific to the variety of wheat while cost of production is for all wheat grown in a region or for the US. Because the farm commodity program is for all wheat, it was decided to create a composite projected and harvest wheat insurance price by weighting the insurance price for hard red winter, soft red winter, hard red spring, and durum wheat by each variety’s share of the sum of these four wheat varieties produced in the US that year.
Many crops have a secondary product that is a source of revenue from producing the crop. Examples are hay for barley, oats, and wheat, and cottonseed for upland cotton. The value of secondary products for 2014-2023 are from USDA, ERS’s costs and returns data set. The average ratio of the value of secondary to primary product for 2014-2023 is applied to the 2024 primary product revenue estimate to provide an estimate of the value of the secondary product(s) from 2024 production.
References and Data Sources
Coppess, J. “Squeezing the Farmer, Part 1: Initiating Examination of a Persistent Challenge.” farmdoc daily (14):175, Department of Agricultural and Consumer Economics, University of Illinois at Urbana-Champaign, September 26, 2024.
U.S. Department of Agriculture, Economic Research Service. October 2024. Commodity Costs and Returns. https://www.ers.usda.gov/data-products/commodity-costs-and-returns/
U.S. Department of Agriculture, National Agricultural Statistical Service. October 2024. Quick Stats. https:///quickstats.nass.usda.gov
U.S. Department of Agriculture, Risk Management Agency. October 2024. Price Discovery Reporting. https://prodwebnlb.rma.usda.gov/apps/PriceDiscovery
Disclaimer: We request all readers, electronic media and others follow our citation guidelines when re-posting articles from farmdoc daily. Guidelines are available here. The farmdoc daily website falls under University of Illinois copyright and intellectual property rights. For a detailed statement, please see the University of Illinois Copyright Information and Policies here.


