


The Financial Efficiency of Illinois Grain Farms: Interest Expense Ratio by Farm Size
In February, the Economic Research Service’s (ERS) Farm Sector Income Forecast projected farm sector debt to increase by 3.7% or $19.8 billion to $561.8 billion in 2025 (USDA-ERS, February 6, 2025 [a]). Despite the rise in debt, the ERS anticipates a decrease in interest expenses in 2025, along with reduced spending on inputs such as fertilizer, pesticides, fuel, and oils (USDA-ERS, February 6, 2025 [b]). While the Federal Open Market Committee (FOMC) paused their rate-cutting cycle in January, two rate cuts are still expected this year. However, economic growth concerns intensified last week when the Atlanta Fed’s GDPNow model revised its first-quarter gross domestic product (GDP) forecast from a 2.3% increase (February 19) to a 2.8% decline.[1] Should US GDP contract this quarter, given the Trump administration’s planned federal spending cuts and new tariffs on Canada, Mexico, and China, the likelihood of additional and larger rate cuts this year could increase.
The current interest rate environment remains elevated relative the pre-pandemic era. Between March 2022 and July 2023, the FOMC raised the federal funds rate (FFR) 11 times, increasing it by 5.25 percentage points—from near zero to a range of 5.25% to 5.50%. This was the fastest and largest rate hike in four decades. Although recent rate cuts have alleviated some borrowing pressures, the Fed’s decision to pause their rate-cutting cycle suggests higher borrowing costs will persist for a few more months this year. In our previous article (see farmdoc daily, February 28, 2025), we examined regional differences in median interest expense ratios for Illinois grain farms. We now shift our focus and consider the size of the grain farm and how this ratio has trended from 2003 to 2023.
The interest expense ratio is a financial efficiency measure and represents the share of gross farm income used to make interest payments on debt. It is calculated by dividing accrued interest expense by gross farm returns. According to the Farm Financial Scorecard developed by the Center for Farm Financial Management, a farm with an interest expense ratio that is greater than 10% is categorized as vulnerable, a ratio between 5% and 10% is categorized as cautionary, and a ratio that is less than 5% is categorized as strong.[2] Therefore, the lower the interest expense ratio, the more efficient the farm is. In our figure below, we categorize the interest expense ratio based on the size of gross farm returns: small, medium-sized, and large grain farms. Small farms are defined as those with gross farm returns less than $350,000; medium-sized farms have returns between $350,000 and $999,999; and large farms have returns greater than $999,999. Additionally, we use the color-coding system from the Farm Financial Scorecard to indicate the category of each farm’s interest expense ratio. The region shaded in red indicates a vulnerable ratio, yellow represents a cautionary ratio, and green indicates a strong ratio.
Figure 1 shows the median interest expense ratios for grain farms in Illinois categorized by the size of their gross farm returns. Despite large grain farms reporting a much higher median ratio in 2003, the ratios across all three size categories have trended similarly over the past two decades. In most years, large grain farms reported higher (less efficient) median interest expense ratios, while small grain farms reported the lowest median ratios.
Between 2006 and 2012, the median ratio trended lower, reflecting an improvement in the financial efficiency of grain farms across all three size categories. However, the trend reversed and moved upwards after 2012 before peaking in 2019, coinciding with a period of lower grain prices and gross incomes. During this period, large grain farms saw median total liabilities increase 53.27%, from $1,057,108 to $1,620,203, while their median interest expense more than double, increasing by 111.54%, from $28,544 to $60,381. On the other hand, small grain farms only increased their median total liabilities by 26.41% from $184,665 to $233,434, with their median interest expense increasing by 19.26%, from $4,558 to $5,436.
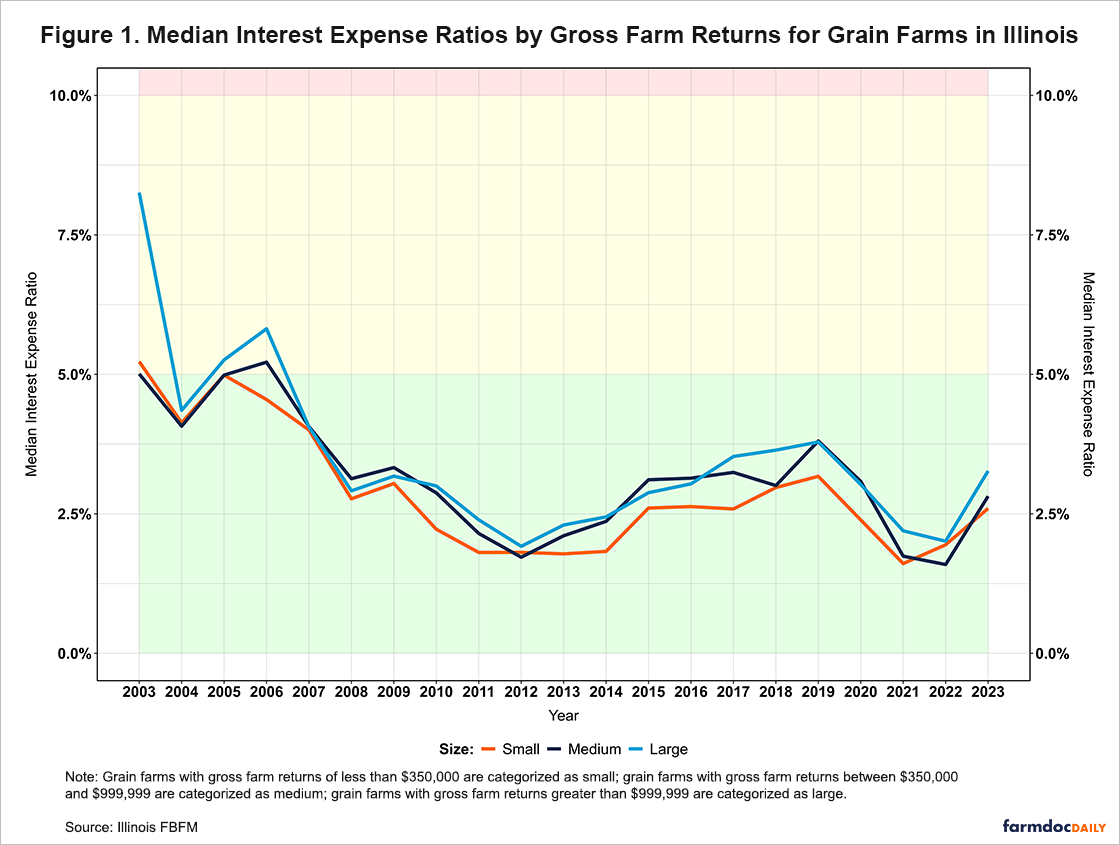
From 2019 to 2022, medium-sized and large grain farms experienced improvements in their median ratios. Medium-sized farms reached a record-low ratio of 1.59% (strong) in 2022. Small farms improved too and hit their lowest median ratio of 1.61% (strong) in 2021 but saw slower subsequent increases compared to larger operations. During this period, gross incomes rose to their highest levels, while debt also increased. By 2023, the median ratios stood at 2.60% (strong) for small grain farms, 2.82% (strong) for medium-sized grain farms, and 3.27% (strong) for large grain farms, all of which were in the strong range despite rising interest rates.
Conclusion
While the ERS projects a 3.7% ($19.8 billion) rise in farm sector debt in 2025, anticipated declines in interest expenses and other input costs may alleviate pressure on farm balance sheets. Our analysis of Illinois grain farms reveals that while large farms have historically reported higher interest expense ratios, all farm sizes have shown similar trends over the past two decades. Larger farms tend to utilize debt more extensively, resulting in slightly higher interest expense-to-gross income ratios. However, given the uncertain interest rate environment and evolving economic landscape, proactive financial management remains important.
Acknowledgment
The authors would like to acknowledge that data used in this study comes from the Illinois Farm Business Farm Management (FBFM) Association. Without Illinois FBFM, information as comprehensive and accurate as this would not be available for educational purposes. FBFM, which consists of 5,000+ farmers and 70 professional field staff, is a not-for-profit organization available to all farm operators in Illinois. FBFM field staff provide on-farm counsel along with recordkeeping, farm financial management, business entity planning and income tax management. For more information, please contact our office located on the campus of the University of Illinois in the Department of Agricultural and Consumer Economics at 217-333-8346 or visit the FBFM website at www.fbfm.org.
Notes
[1] The Atlanta Fed GDPNow estimate is a model-based projection not subject to judgmental adjustments. It is not an official forecast of the Atlanta Fed, its president, the Federal Reserve System, or the Federal Open Market Committee.
[2] The Farm Financial Scorecard adheres to the guidelines set by the Farm Financial Standards Council
References
Mashange, G. and B. Zwilling. "The Financial Efficiency of Illinois Grain Farms: Interest Expense Ratio." farmdoc daily (15):39, Department of Agricultural and Consumer Economics, University of Illinois at Urbana-Champaign, February 28, 2025.
U.S. Department of Agriculture, Economic Research Service. (2025, February 6). Farm sector income & finances: Farm sector income forecast. https://www.ers.usda.gov/topics/farm-economy/farm-sector-income-finances/farm-sector-income-forecast
U.S. Department of Agriculture, Economic Research Service. (2025, February 6). Webinar: Farm Income and Financial Forecasts, February 2025 Update. https://www.ers.usda.gov/sites/default/files/2025_02_06%20Farm%20Income%20Webinar%20Transcript.pdf
Disclaimer: We request all readers, electronic media and others follow our citation guidelines when re-posting articles from farmdoc daily. Guidelines are available here. The farmdoc daily website falls under University of Illinois copyright and intellectual property rights. For a detailed statement, please see the University of Illinois Copyright Information and Policies here.