


Illinois Agricultural Credit Conditions: 2024 Q4
The data series in the Federal Reserve District Surveys of Agricultural Credit Conditions compiles selected statistics from quarterly surveys conducted by participating Federal Reserve Districts. These surveys collect responses each quarter from commercial banks chartered within the geographic boundaries of each district. Our analysis is limited to the two Federal Reserve Districts that serve Illinois: the Federal Reserve Bank of Chicago, which covers 58 counties, and the Federal Reserve Bank of St. Louis, which covers 44 counties as shown in Figure 1.

Demand for Loans
In the fourth quarter of 2024, loan demand in the Chicago District exceeded that of the St. Louis District as shown in Figure 2. Surveyed bankers evaluate loan demand by comparing current-quarter conditions to the same period last year, indicating whether they are higher, lower, or the same. With these responses, a diffusion index is calculated for each district by subtracting the percentage of bankers who responded “lower” from the percentage who responded “higher,” and then adding 100. When the diffusion index is greater than 100, then the demand for loans is increasing and vice versa. Loan demand rose in 2023 and remained steady in the St. Louis District in 2024. In the Chicago District, loan demand rose by a larger amount from 2023 to the first quarter of 2024, and briefly experienced a decline from the first quarter to the second, before rebounding again in the second half of the year. The reduction in working capital over the past 24 months is reflected by the rise in borrowing needs. According to data from the Illinois Farm Business Farm Management (FBFM) Association, the average amount of working capital for the 2,121 farms in the sample decreased by 17% in 2023, falling from $593,813 in the prior year to $494,571 (see farmdoc daily, October 18, 2024). In that year, grain farms reported the highest average working capital at $511,659, while dairy farms had the lowest at $167,755. Hog farms averaged $466,446 in working capital, and beef farms reported $244,726. Initial reviews of the 2024 FBFM data indicate that working capital decreased by 20 to 30%, while liabilities increased by 2 to 7%, and interest expense rose by 20 to 30%.

Loan Repayment Rate
As shown in Figure 3, loan repayment rates have been trending lower in both districts since the first quarter of 2022. Starting in the fourth quarter of 2023, the index value has been below 100 for five consecutive quarters. In their 2024 Agricultural Lender Survey, the American Bankers Association and the Federal Agricultural Mortgage Corporation (Farmer Mac) reported credit quality and agricultural loan deterioration as the top concern facing agricultural lenders. Additionally, lenders also indicated that they anticipate credit quality to worsen over the next 12 months from August, driven by carryover crop from 2023, along with high production costs, low commodity prices, and high interest rates collectively placing pressure on producers, particularly for row crop operators such as corn and soybeans.

Interest Rates
Figures 4 and 5 show the average fixed interest rates on operating and real estate loans, respectively. The costs on borrowed funds in recent years are considerably higher than they were prior to 2022. Between March 2022 and July 2023, the Fed implemented 11 rate hikes, increasing the federal funds rate (FFR) by 5.25 percentage points—from near 0% to a range of 5.25% to 5.50%. This was the fastest and largest rate hike in four decades. Following the tightening cycle, the Fed began cutting rates in September 2024, reducing the FFR by 0.5 percentage points to a range of 5.00% to 5.25%. Two subsequent rate cuts of 0.25 percentage points each in November and December brought the FFR to 4.25%-4.50% by year-end.
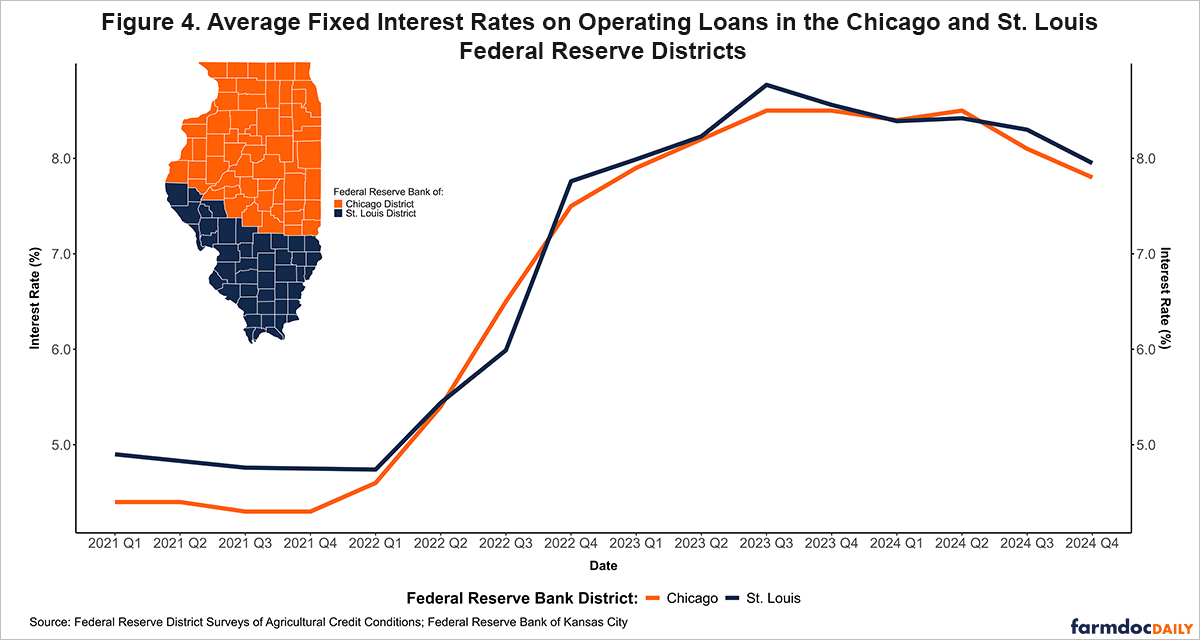

In the fourth quarter of 2024, average fixed interest rates on operating loans stood at 7.80% in the Chicago Fed District and 7.95% in the St. Louis Fed District. These rates have remained relatively similar in both districts since the tightening cycle began in 2022 and have been trending lower since the third quarter of 2023. In contrast, average fixed interest rates on real estate loans between the two districts widened in the fourth quarter of 2022. Since then, the average interest rate on real estate loans in the St. Louis District has remained higher than the rate in the Chicago District. From the third quarter of 2023 to the fourth quarter of 2024, the average fixed real estate loan rate declined by a total of 64 basis points in St. Louis—from 8.41% to 7.77%—while the Chicago district experienced a smaller decrease of 50 basis points, from 7.70% to 7.20%, over the same period.
In Illinois, the percentage increase in debt levels has been much smaller compared to the rise in interest expenses in recent years. Data from the FBFM shows that grain farms reported a 39.27% increase in median interest expense, rising from $15,102.50 in 2021 to $21,034 in 2023. Over the same period, median total liabilities increased by 10.96%, from $630,681.50 in 2021 to $699,800 in 2023. Furthermore, median net farm incomes declined by 82.57% over the same period, dropping from $273,282 to $47,646, and average farm operating income (before gains or losses on equipment) fell from $335,381 to $21,719—a 93.52% decrease.
Conclusion
Broadly speaking, financial stress remained limited across Federal Reserve Districts participating in the Ag Credit Surveys, despite agricultural credit conditions deteriorating modestly in the fourth quarter (see Kreitman and Kauffman, March 6, 2025). Our analysis of agricultural credit conditions in the Chicago and St. Louis Federal Reserve Districts highlights several key trends. Loan demand in the St. Louis District remained relatively stable in 2024, while the Chicago District saw an upward trend in recent quarters. Meanwhile, loan repayment rates in both districts have steadily declined since the first quarter of 2022. Preliminary data from FBFM indicates that working capital decreased by 20 to 30% in 2024, liabilities increased by 2 to 7%, and interest expenses rose by 20 to 30%.
Acknowledgment
The authors would like to acknowledge that data used in this study comes from the Illinois Farm Business Farm Management (FBFM) Association. Without Illinois FBFM, information as comprehensive and accurate as this would not be available for educational purposes. FBFM, which consists of 5,000+ farmers and 70 professional field staff, is a not-for-profit organization available to all farm operators in Illinois. FBFM field staff provide on-farm counsel along with recordkeeping, farm financial management, business entity planning and income tax management. For more information, please contact our office located on the campus of the University of Illinois in the Department of Agricultural and Consumer Economics at 217-333-8346 or visit the FBFM website at www.fbfm.org.
References
American Bankers Association-Farmer Mac Agricultural Lender Survey, August 2024.
Kreitman, T and Kauffman, N. “Farm Real Estate Values were Steady in 2024” Ag Finance Update. Federal Reserve Bank of Kansas City / Denver / Oklahoma City / Omaha. March 6, 2025.
Zwilling, B. "Financial Summary of Illinois Farms for 2023." farmdoc daily (14):190, Department of Agricultural and Consumer Economics, University of Illinois at Urbana-Champaign, October 18, 2024.
Disclaimer: We request all readers, electronic media and others follow our citation guidelines when re-posting articles from farmdoc daily. Guidelines are available here. The farmdoc daily website falls under University of Illinois copyright and intellectual property rights. For a detailed statement, please see the University of Illinois Copyright Information and Policies here.