


US Farm Program Crops in the Planting Flexibility Era
In the farmdoc daily of March 3, 2025, we documented the importance of the 1990 Farm Bill policy decision to give US farmers the freedom to make planting decisions less constrained by government commodity programs. That article focused on corn, soybeans, and wheat, the three largest acreage farm program crops. In this article, we extend the analysis to other 1990 farm program crops as well as hay, the third largest US field crop in acres. These crops have evolved into three groups. Corn and soybeans have become the Foundational Crops of modern agriculture. Their acres are large and increasing. Hay and wheat are legacy large acreage crops. Their acres are large, but declining. The remaining 1990 program crops have smaller acreages, with increasing geographical concentration.
Current US Planted Acres by Crop
Average planted acres were calculated for 1991-95 and 2021-24 using data from QuickStats, USDA, NASS (US Department of Agriculture, National Agricultural Statistics Service). The earlier period is the first four years of the planting flexibility era. The later period is the last four available years. Four-year periods are used to smooth year-to-year variability and to take crop rotations into account.
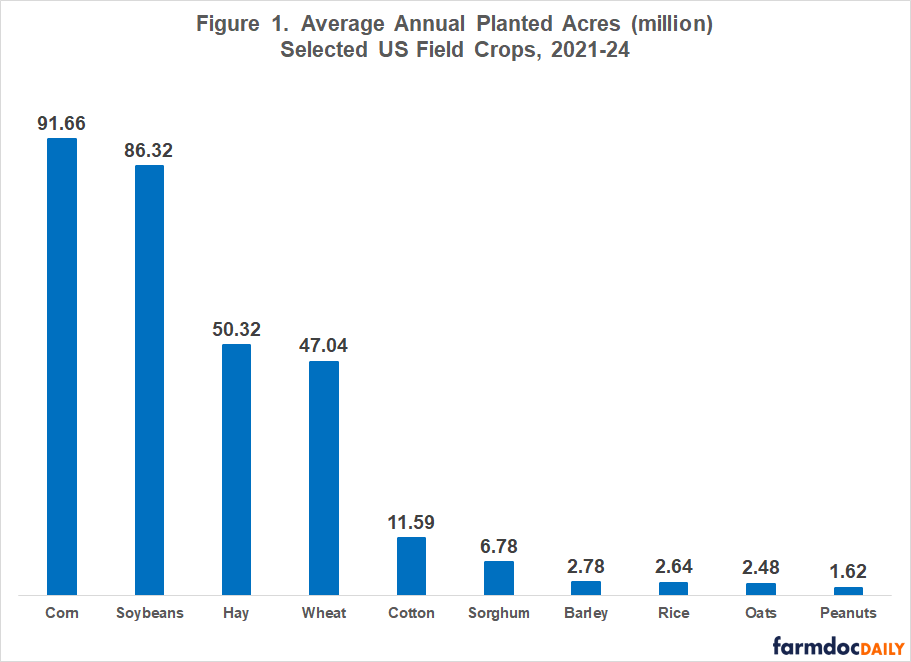
The 10 crops in this study averaged 303 million planted acres per year over 2021-24 (see Figure 1). Corn-soybeans averaged 178 million acres. Hay-wheat averaged 97 million acres. The other six crops averaged 28 million acres.
Percent Change in Planted Acres by Crop
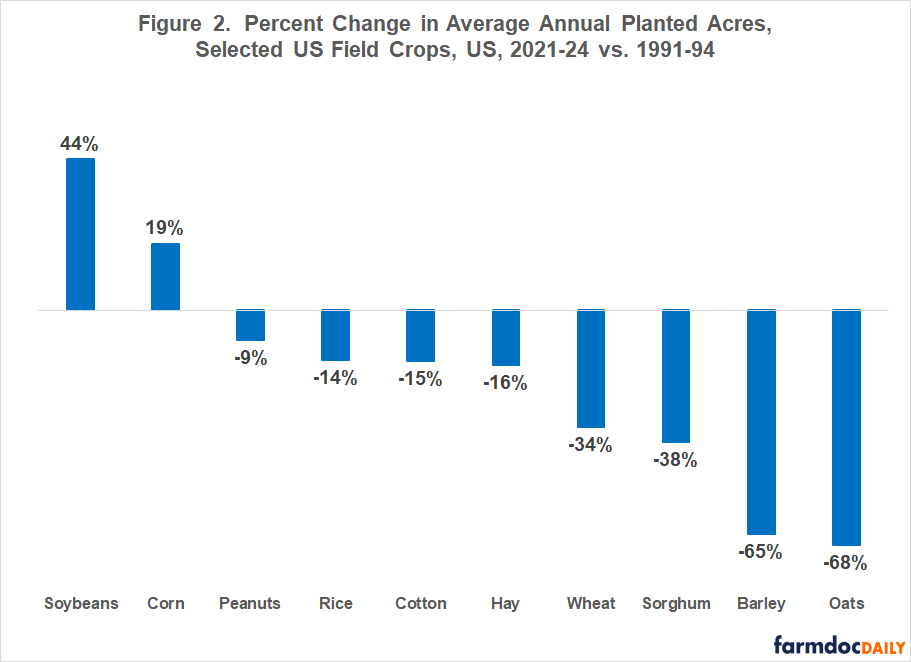
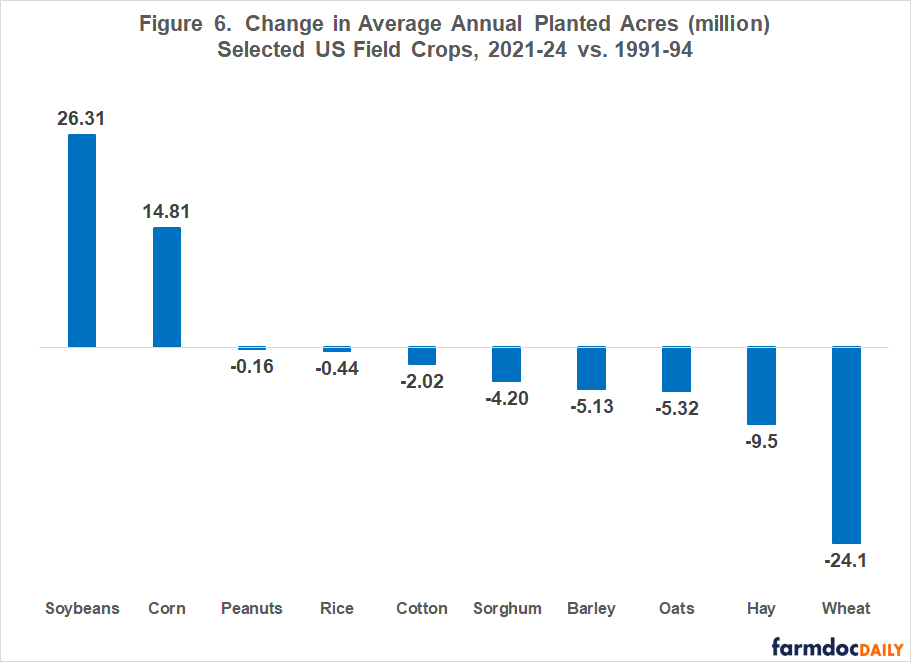
Only two of the crops have more planted acres now than in the early 1990s. Soybean acres are up 44% while corn acres are up 19% (see Figure 2). Acres of the other 8 crops have declined by at least 9% (peanuts). Hay and wheat acres are down 16% and 34%, respectively. Figure 6 at the end of this article contains the change by crop in million acres.
Other Planting Flexibility Outcomes
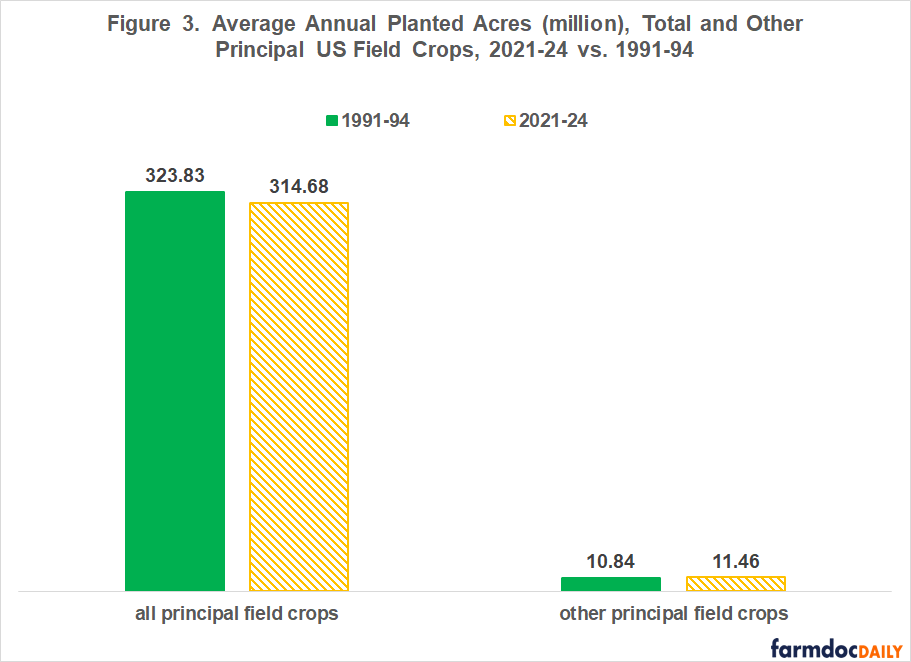
Planting flexibility allowed farmers to plant any crop except fruits, vegetables, and wild rice. Planting of principal field crops other than the 10 crops in this study have increased 0.62 million acres, or 6% (see Figure 3). Planting flexibility also allowed farmers to not plant a crop and retain program base acres. Total acres planted to principal field crops have declined 9.15 million, or 3% (see Figure 3). The relatively small impact of these two planting flexibility provisions suggests program crops are generally the most profitable use of cropland at least at the US level and given the market dynamics and policy mix that has existed since 1990. US principal crops are listed in Data Note 1.
Geographical Concentration
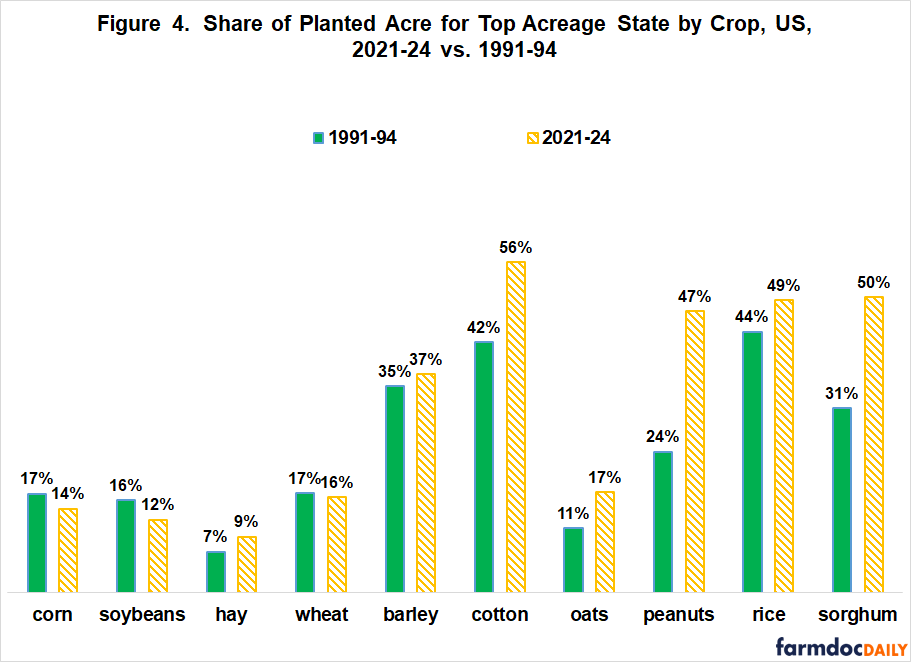
Geographical concentration differs notably between the four larger acreage crops and six smaller acreage crops. In 2021-24, the largest state accounted for at most 16% of US planted acres of corn, soybeans, hay, and wheat (see Figure 4). In contrast, the largest state accounted for 37% or more of US acres for the other crops except oats (17%). The 3-state concentration ratios in 2021-24 also differ notably (see Figure 5). Of the larger acreage crops, 3-state concentration is highest for wheat (42%). In contrast, 3-state concentration is 70% or higher for the smaller acreage crops, again except oats (40%).
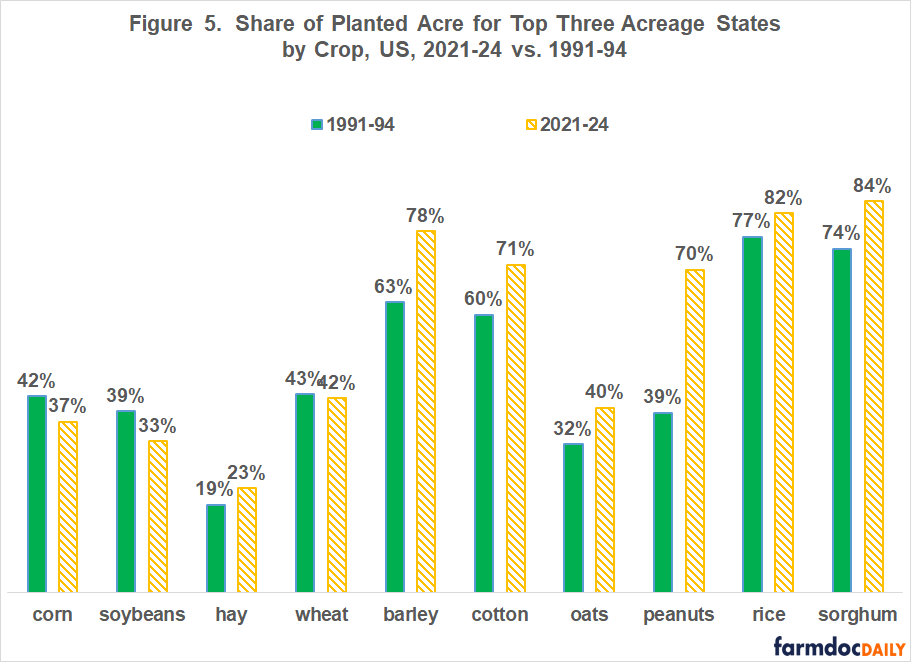
Trend in concentration also differs. One and three state concentrations for corn, soybeans, hay, and wheat have changed only marginally, with the largest changes being declines for corn and soybeans. Excluding the top-state concentration ratio for barley, concentration for the other six crops have increased by at least 5 percentage points, with double digit increases being as common as single digit increases.
Acreage Relationships
To further explore changes in acres since planting flexibility was authorized, the correlation between changes in acres from 1991-94 to 2021-24 was examined for crop-state combinations that had data for all eight years. We will discuss only the six correlations that are significant with 95% statistical confidence. A 2-tail statistical test was used because acres can increase and decrease.
Five of the six correlations are negative (see Table 1), implying that, as acres increase for one crop, acres decline for the other crop. At the state level, declines in wheat acres were more strongly related to increases in corn acres than to increases in soybean acres. Respective explanatory power was 75% and 59%. The farmdoc daily of March 3, 2025 reached the same conclusion. Its analysis was limited to states with over one million acres each of corn and soybeans.
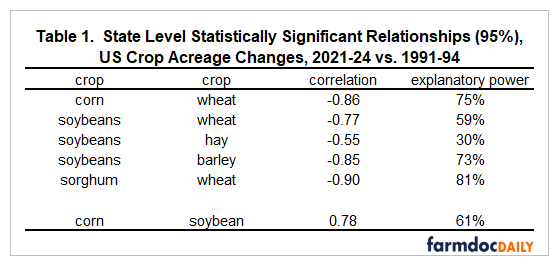
The large increase in soybean acres since 1990 is statistically related to declines in wheat, hay, and barley acres. Soybeans-barley had the strongest relationship. Its explanatory power was 73%.
Wheat also had a statistically significant negative relationship with sorghum even though US acres of both crops have declined. This finding might be due to random chance. On the other hand, a negative correlation is consistent with the growth in US production of animals and animal products, which implies the need for more feed grain acres. Sorghum and wheat are grown in drier agriclimates, but sorghum is primarily a livestock feed grain while wheat in the US is primarily a human food grain.
The only positive correlation that is significant with 95% statistical confidence is for corn and soybeans, underscoring the intertwined relationship of these two crops in modern agriculture.
Discussion
Since 1990,
- Corn and soybeans have become the Foundational Crops of Modern Agriculture as acres increase.
- Hay and wheat have become Legacy Large Acreage Field Crops as acres decline.
- Other 1990 program crops have declined and become increasingly concentrated in a few states.
Oats is an outlier. Of the 10 crops in this study, its acres declined the most (-68%) but remain geographically dispersed. Lack of geographical concentration is likely a key reason oats consistently receives some of the lowest payments from commodity programs, despite being a historically important crop (see farmdoc daily of June 17, 2020). Geographical concentration of smaller acreage crops increases the likelihood that Congressional champions exist.
Data Note 1
Principal crops are barley, canola, chickpeas, corn, cotton, dry edible beans, hay, oats, peanuts, potatoes, proso millet, rice, rye, sorghum, soybeans, sugar beets, sugarcane, sunflower, tobacco, and wheat. Harvested acres are used for hay, sugarcane, and tobacco. Acres include acres of unharvested small grains planted as cover crops and double cropped acres.
References and Data Sources
US Department of Agriculture, National Agricultural Statistics Service. January 15, 2024. QuickStats. http://quickstats.nass.U.S.da.gov/
Zulauf, C., J. Coppess, G. Schnitkey and N. Paulson. “US Corn, Soybean, and Wheat Acres in the Planting Flexibility Era.” farmdoc daily (15):40, Department of Agricultural and Consumer Economics, University of Illinois at Urbana-Champaign, March 3, 2025.
Zulauf, C., G. Schnitkey, J. Coppess, N. Paulson and K. Swanson. “ARC-CO and PLC Payment per Base Acre – 2014 Farm Bill.” farmdoc daily (10):110, Department of Agricultural and Consumer Economics, University of Illinois at Urbana-Champaign, June 17, 2020.
Disclaimer: We request all readers, electronic media and others follow our citation guidelines when re-posting articles from farmdoc daily. Guidelines are available here. The farmdoc daily website falls under University of Illinois copyright and intellectual property rights. For a detailed statement, please see the University of Illinois Copyright Information and Policies here.