


Demise of the US Countercyclical Crop Safety Net
The US crop safety net has undergone a profound transformation. From 1975 through 2006, crop safety net payments were negatively correlated, or countercyclical, with private market returns. High payments occurred when market returns were low. Since 2006, no correlation has existed. Payments have been high even when market returns were high.
Crop Safety Net Payments Since 1975
Figure 1 presents the time path of the aggregate private market returns at harvest, crop safety net payments, and combined returns since 1975 for the nine field crops for which USDA, ERS (US Department of Agriculture, Economic Research Service) computes an economic cost of production. The crops are barley, corn, cotton, oats, peanuts, rice, sorghum, soybeans, and wheat. The safety net contains commodity, crop insurance, and ad hoc & emergency programs. Insurance payments are indemnities net of farmer-paid premiums. For more discussion of the data and calculations, see Data Notes 1 and 2.
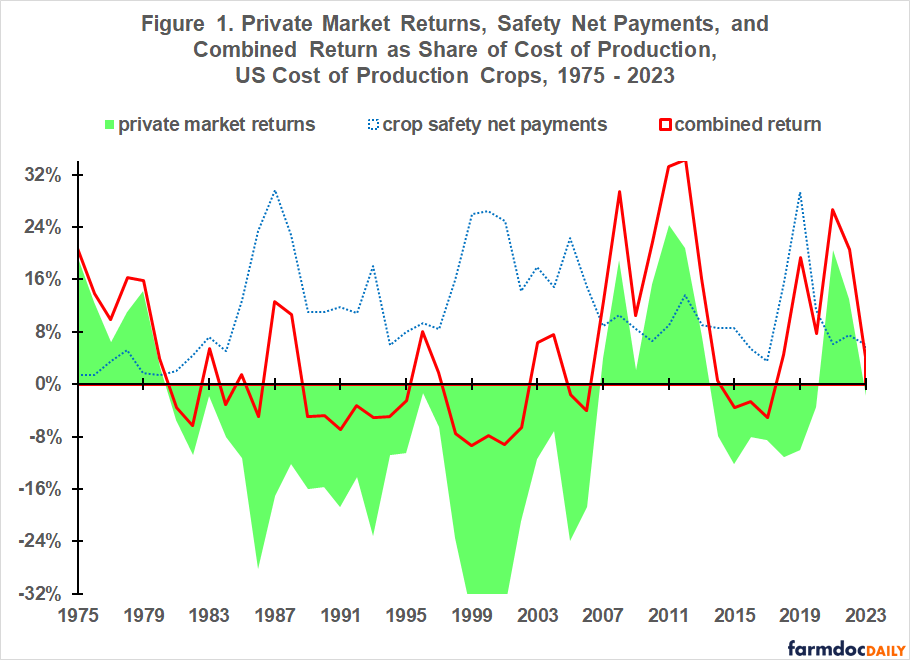
Four distinct private market return periods exist. The first is 1975-80. Private market return was positive in all 6 years, averaging 11% / year for the cost of production crops as a group (see Figure 2). This prosperity coincided with a large increase in exports of US field crops. The second period is 1981-06. Private market return was negative in all 25 years, averaging -16% / year. The third period is 2007-13. Private market return was positive in all 7 years, averaging 13% / year. This prosperity coincided with the early years of the Renewable Fuels Standard (RFS). The fourth period is 2014-23. Private market return was negative in 8 of the 10 years, averaging -3% / year over the 10 years.
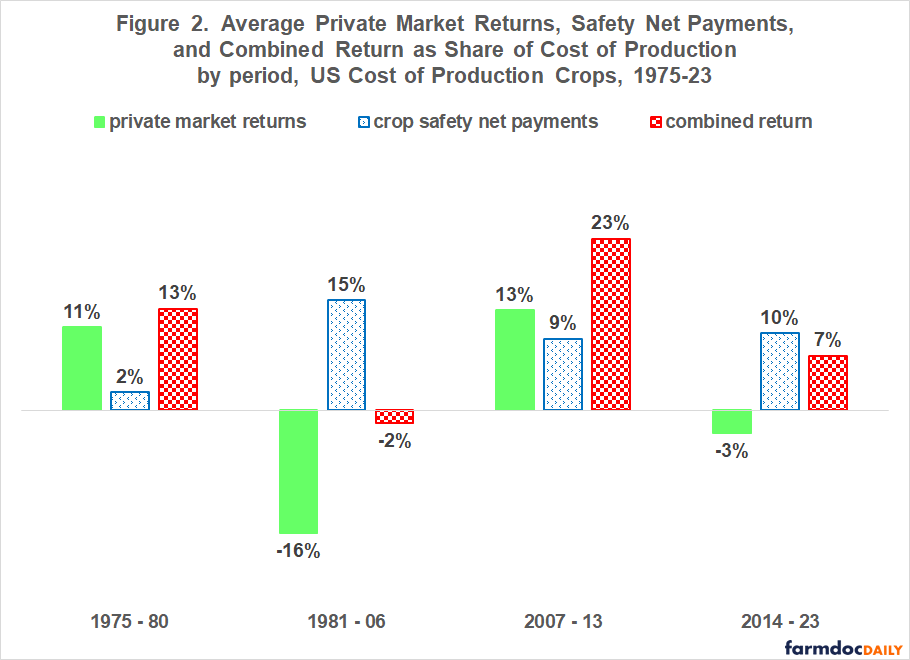
The crop safety net’s transformation is evident when comparing the two prosperity periods. During 1975-80, safety net payments approached zero, averaging 2% / year. During 2007-13, payments averaged 9% / year even though private market returns averaged 13% / year.
The transformation is also evident when comparing the other two periods. During 1981-06, crop safety net payments offset most, but not all private market losses. Combined return averaged -2% / year. Combined return during 2014-23 averaged 7% / year as safety net payments averaging 10% / year more than offset private market losses averaging 3% / year.
Figure 3 further illustrates the transformation. Over the two periods prior to 2007 (left panel), crop safety net payments were decidedly countercyclical. High safety net payments were associated with low private market returns while low safety net payments were associated with high private market returns. The negative relationship’s explanatory power was 67%. Statistical confidence was 99%. The outlier is 1987, a year with high safety net payments as the US substantially lowered support prices to improve private market competitiveness. Removing 1987 increases explanatory power to 73%.
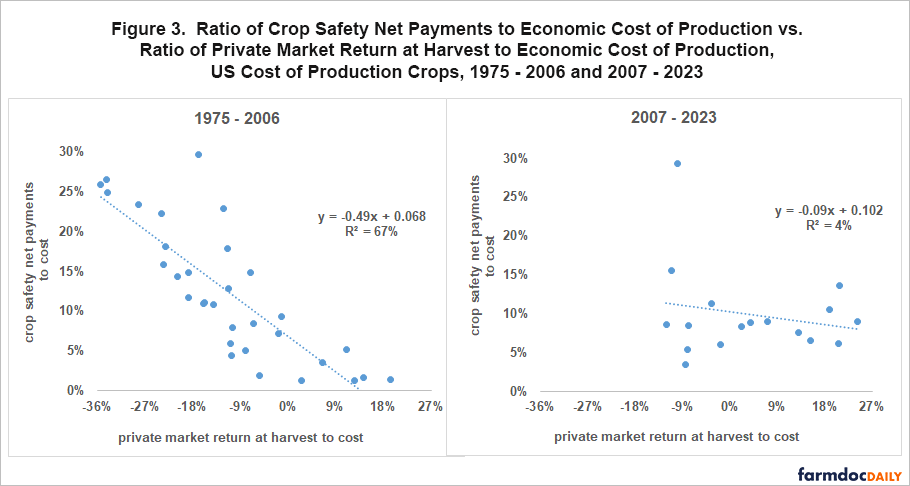
Over the two periods since 2006 (right panel), the relationship is statistically insignificant with an explanatory power of only 4%. The outlier is not the COVID-19 years of 2020 and 2021 but 2019. It was a year of large ad hoc Market Facilitation Program (MFP) payments to the cost of production crops. Removing 2019 results in an explanatory power of 0%.
Policy Implications
Demise of the historical countercyclical crop safety net became apparent during the 2007-13 period of crop prosperity when Congress decided to continue the direct payment program of fixed payments per output unit despite private market returns that notably exceeded the economic cost of production and despite authorization of the Renewable Fuels Standard (RFS).
Since 2007, the crop safety net has added to returns even when private market returns notably exceeded the cost of production.
We will continue to explore this profound transformation in subsequent articles, starting with an assessment of the countercyclical performance of the three program types in the crop safety net: commodity, crop insurance, and ad hoc & emergency.
Data Note 1: Crop Safety Net Payments (For an in-depth discussion of the data and calculations used for this article, see Zulauf, Langemeier, and Schnitkey (2022)).
The crop safety net is composed of commodity, crop insurance, and ad hoc & emergency programs. Commodity programs since 1975 are: Average Crop Revenue Election (ACRE), Agriculture Risk Coverage (ARC), certificate exchange, cotton, cotton ginning, cotton transition, countercyclical (CCP), direct (DP), feed grain, loan deficiency, marketing loan, Price Loss Coverage (PLC), Production Flexibility Contract (PFC), rice, and wheat. Most payment data for these programs are from USDA, ERS Farm Income and Wealth dataset. The exceptions are 1985-1994 loan deficiency and marketing loan payments, which are from USDA, FSA (Farm Service Agency); and market loss and oilseed program payments for 1998-01, which are also from USDA, FSA.
Crop insurance payments are indemnities paid to US farms minus premiums paid by US farms. They are calculated using data from USDA, RMA (Risk Management Agency) Summary of Business. Payments by the ad hoc Market Facilitation, market loss, and oilseed programs were from USDA, FSA. They are available by crop and crop year. All other ad hoc & emergency payments from 2002 through 2024, including COVID-19 related payments, are from USDA, ERS Farm Income and Wealth dataset. They are available only for all US farms by calendar year. These payments are assigned to the nine cost of production crops based on their combined share of total US farm cash receipts by year. The share varied from 22% to 37%.
FSA and RMA data are reported by crop year. Farm income and Wealth data are reported by calendar year. Use of multiple-year periods should minimize the impact of this reporting difference.
Data Note 2: USDA, ERS Economic Cost Data (For an in-depth discussion of the cost of production data, see “Documentation: USDA Cost of Production Data.”)
USDA, ERS calculates an economic cost per acre planted to barley, corn, cotton, oats, peanuts, rice, sorghum, soybeans, and wheat. A cost is assigned to all inputs except management needed to plant, harvest, and put the crop in condition for storage. Unpaid labor and farmer-owned land are assigned an opportunity cost. Quantity of inputs is based on periodic surveys of farmers. Input prices are updated annually using USDA, NASS (National Agricultural Statistics Service) data.
USDA, ERS also calculates gross and net return to production per planted acre. Gross return includes income from a crop’s primarily product, such as grain and cotton lint, and secondary product(s), such as straw and cottonseed. Price of the product is for the crop’s harvest period. Gross return does not include government payments, crop insurance indemnities, and storage returns. Cost does not include crop insurance premiums and storage costs. USDA, ERS thus calculates a private market net return at harvest to the economic cost of production.
For each crop year from 1975 through 2023, net return and economic cost per planted acre for a crop and year were multiplied by acres planted to the crop in that year to generate total US net return and total US economic cost for the crop in the year. Total net return and economic cost for the nine cost of production crops for a year were summed to calculate an aggregate net return and economic cost for the nine crops as a group for the year. The aggregate annual net returns and costs for the years in a subperiod were summed. Planted acres are from USDA, NASS QuickStats.
References and Data Sources
US Department of Agriculture, Economic Research Service. February 2025. Farm Income and Wealth Statistics. https://www.ers.usda.gov/data-products/farm-income-and-wealth-statistics/
US Department of Agriculture, Economic Research Service. March 2025. Cost of Production. https://www.ers.usda.gov/data-products/commodity-costs-and-returns/
US Department of Agriculture, Economic Research Service. March 2025. Documentation: USDA Cost of Production Data. https://www.ers.U.S.da.gov/data-products/commodity-costs-and-returns/documentation/
US Department of Agriculture, Farm Service Agency. March 2025. ARC-PLC Program Data https://www.fsa.usda.gov/resources/programs/arc-plc/program-data
US Department of Agriculture, Farmers.gov. July 13, 2020. Market Facilitation Program: Payment Report. https://www.farmers.gov/manage/mfp.
US Department of Agriculture, National Agricultural Statistics Service. March 2025. QuickStats. http://quickstats.nass.U.S.da.gov/
US Department of Agriculture, Risk Management Agency. March 2025. Summary of Business. http://www.rma.U.S.da.gov/
Zulauf, C. M. Langemeier, and G. Schnitkey. 2022. U.S. Crop Profitability and Farm Safety Net Payments since 1975. Journal of the American Society of Farm Managers and Rural Appraisers. Pages 60-69. https://www.asfmra.org/resources/asfmra-journal/2022journal
Disclaimer: We request all readers, electronic media and others follow our citation guidelines when re-posting articles from farmdoc daily. Guidelines are available here. The farmdoc daily website falls under University of Illinois copyright and intellectual property rights. For a detailed statement, please see the University of Illinois Copyright Information and Policies here.