


Research & Conservation: Reviewing the Illinois Dust Storm of 2023
In his award-winning history of the Dust Bowl, Timothy Egan memorably described the early dust storms, marking the point when the weather turned on farmers already decimated by the Great Depression. The “wind blew with a callous edge,” he wrote, “as if it sucked the life out of anything it touched.” He added that “[i]t takes a wind of thirty miles an hour to move dirt; at forty or fifty, it’s a dust storm” (Egan, 2006, at 105). The recipe for dust storms is well-known, combining soils left bare and vulnerable, to be dried out by drought conditions and subjected to high winds (see e.g., farmdoc daily, October 24, 2019; Coppess, 2024). Recent dust storms in Illinois are a far remove from the southwestern Great Plains of the 1930’s, but the recipe remains the same and tragedy can nonetheless result. This article reviews research into the tragic 2023 dust storm and connects it to conservation investments to address soil erosion.
Background
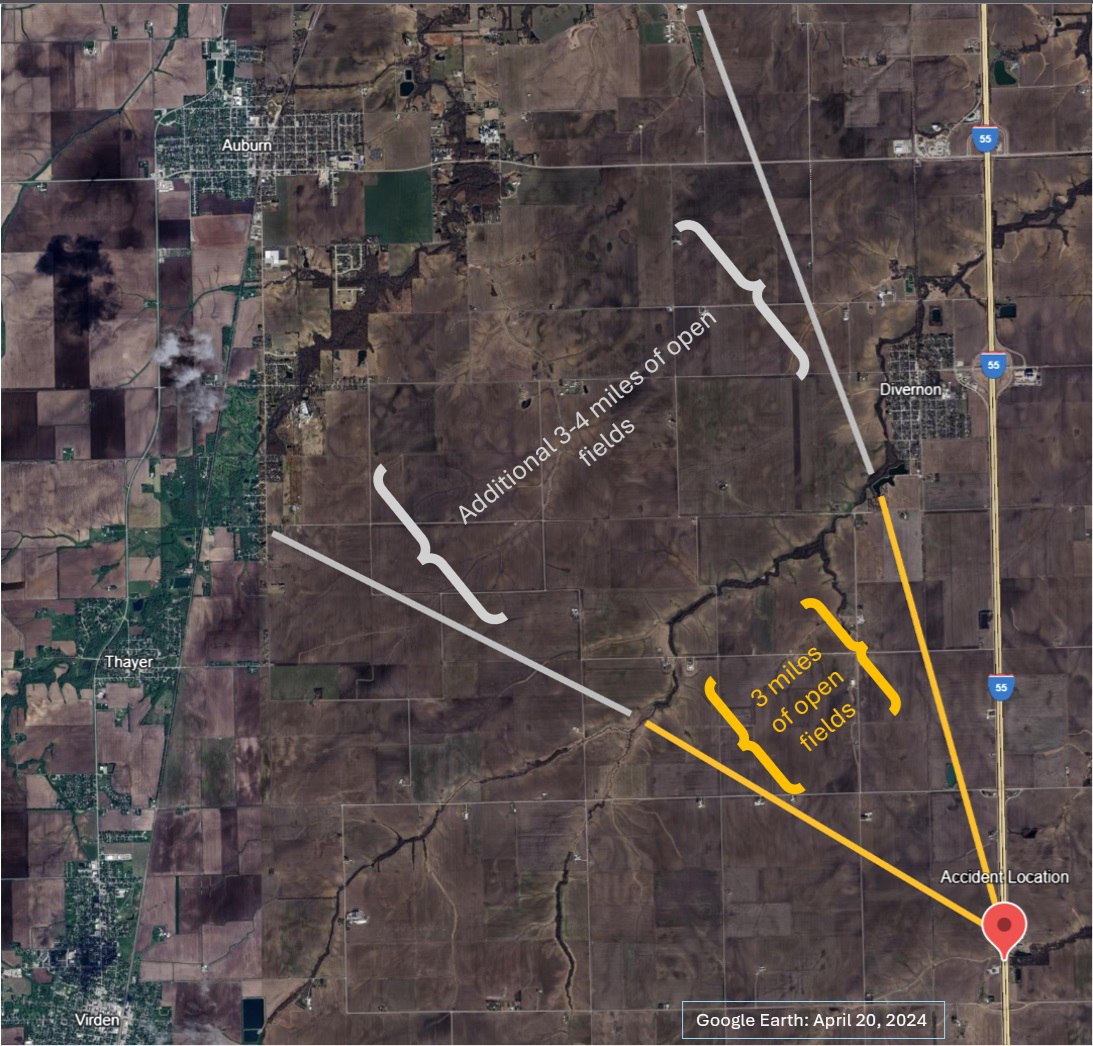
On May 1, 2023, a dust storm south of Springfield, Illinois that reportedly began around 11:00 a.m. impacted Interstate 55. The concentrating dust caused an 84-car pileup; adding further tragedy, eight people died and dozens of other people were injured (Bullington and Sheridan, June 26, 2023; D’Onofrio and Horng, May 10, 2023). Based on news reports, the 2023 incident took place in the northbound lane of Interstate 55 (approximately at 39.505407 N, -89.645350 W, https://maps.app.goo.gl/q6MJqgSzsHWJDozXA), which is in the northern portion of Montgomery County, north of Farmersville and south of Divernon. Figure 1 is a satellite image of the location of the accident using Google Earth, dated April 20, 2024, which is the closest approximation to the date of the accident. The image highlights the site of the fatal accident and the area to the northwest, which was the direction of the wind that day. The image also highlights approximately three miles of open fields from the site to the closest possible windbreak, as well as an additional three-to-four miles of open fields before an additional windbreak.
Figure 1. Satellite Image of Dust Storm Accident Location; Google Earth, dated April 20, 2024
Note that in 2024, another dust storm unfolded further north (near Bloomington, Illinois). It shut down parts of Interstates 55 and 74 (Feurer, May 21, 2024; Roth, May 21, 2024; Denham, June 26, 2024). Thankfully, there was not a repeat of the tragic accident of the year before.
Discussion
In 2023, USDA’s National Institute for Food and Agriculture (NIFA) awarded a competitive grant to a group of researchers through the Agriculture and Food Research Initiative (AFRI) to study the dust storms. The goal is to understand the mechanisms and develop mitigation strategies (USDA-AFRI, 2023-68016-41371; Illinois Institute for Sustainability, Energy, and Environment (iSEE), November 14, 2023). The project includes all listed coauthors, a collaboration of researchers from the University of Illinois, Cornell University, and Texas A&M University.
(1) Field Conditions & Weather
The first half of April 2023 was dry and warm in Illinois, with 159 accumulated growing degree days (compared to the average of 99). The second half of the month was dry and colder (92 growing degree days compared to the average of 132). Illinois experienced low temperatures on the morning of April 24 (upper 20s) with 32.5 degrees the highest minimum temperature reported at Springfield. Overall, April had significantly lower precipitation and higher temperatures than the historical averages. USDA’s National Agricultural Statistics Service (NASS) reported nearly 19 days suitable for fieldwork in the month (USDA-NASS, Illinois Field Office, 2023). These conditions likely resulted in some planting delays (farmdoc, April 8, 2023; April 21, 2023; May 5, 2023; Illinois State Water Survey, WARM).
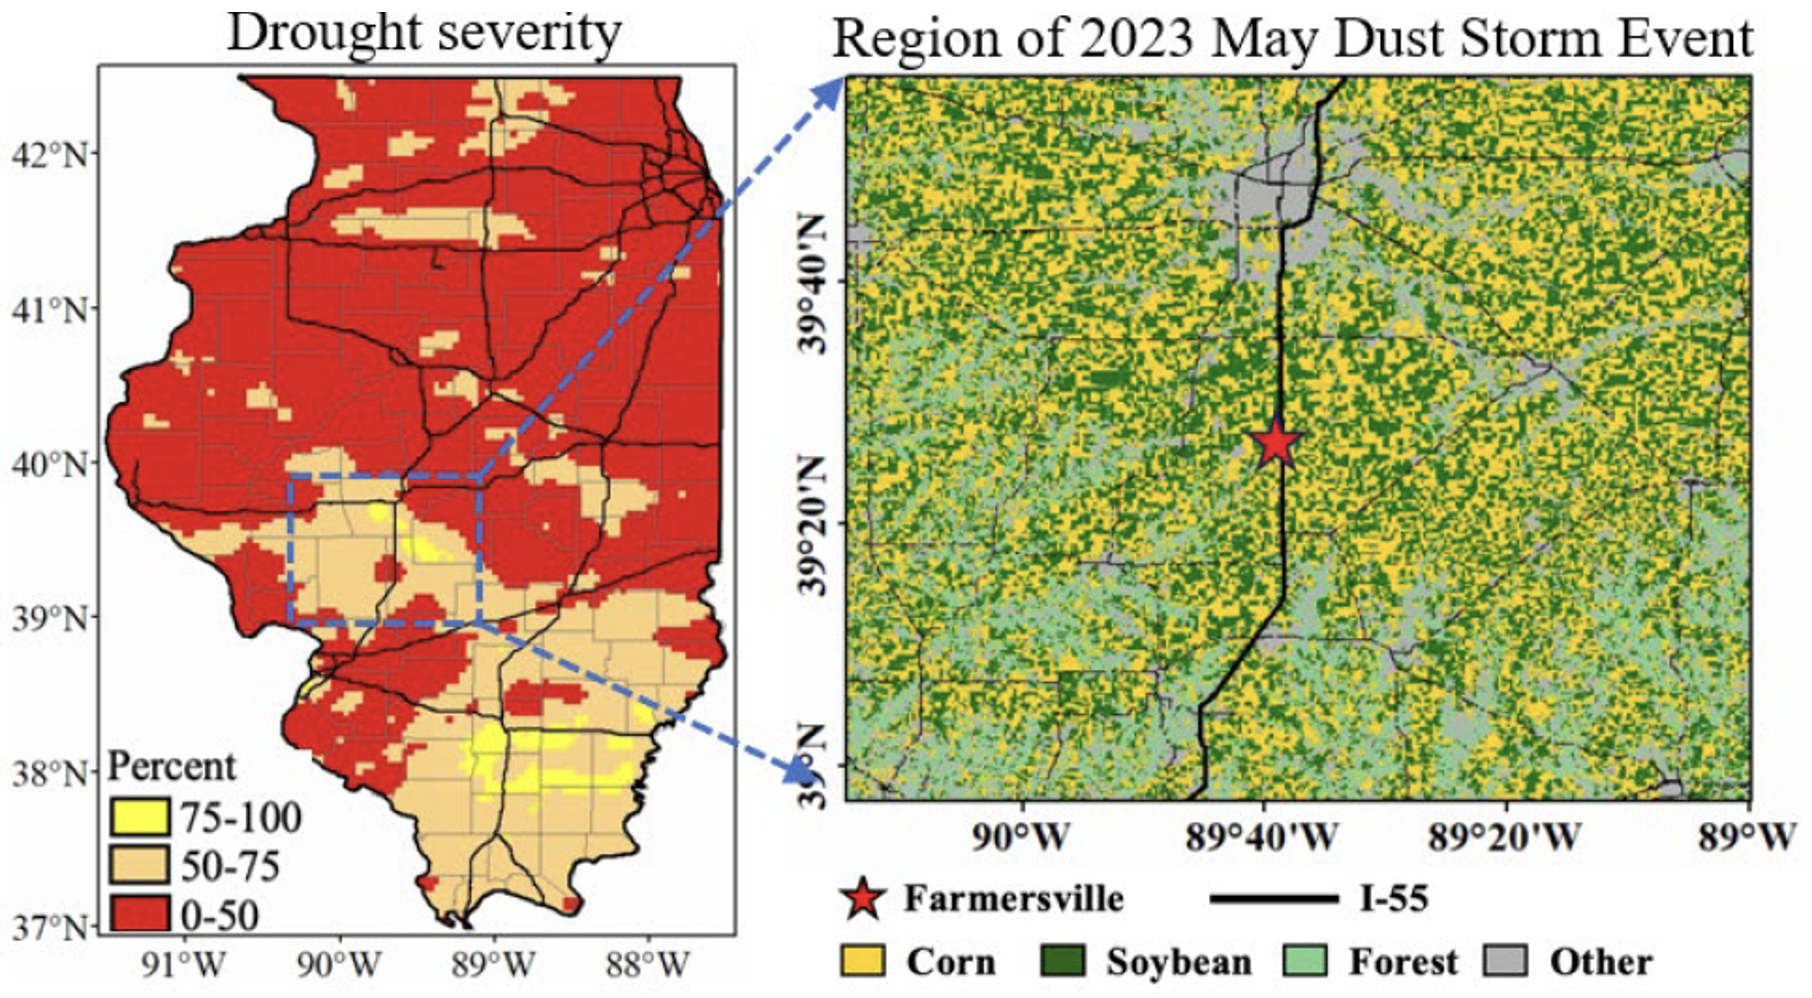
By April 30th, the reports indicated significant deviation in soil moisture from historical averages in the area and as much as 40% to 50% in the areas northwest of the accident site (USDA-NASS, Illinois Field Office, May 1, 2023). The drought conditions in Illinois during the planting season (late April to June) of 2023 are illustrated in Figure 2(a), accumulated rainfall curves with the solid lines illustrating the mean value across Illinois and shaded areas as the standard deviations (PRISM Climate Group). Figure 2(b) adds a spatial pattern of the 2023 planting season drought by combining the data from USDA’s Cropland Data Layer (2022) with the rainfall data. Drought severity is calculated based on the accumulated rainfall during the 2023 planting season as a percentage of the multi-year mean (Cumbie-Ward and Boyles, 2016). The approximate location of the dust storm accident is noted by the red star.
Figure 2(a). Rainfall in Illinois (Source: PRISM Climate Group)
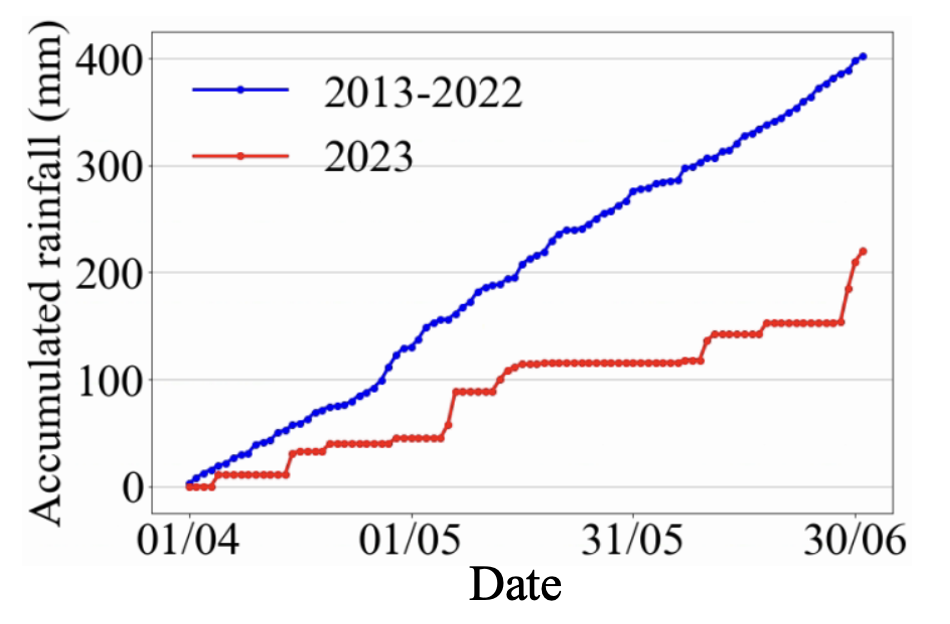
Figure 2(b). Drought Conditions and Region of May 2023 Dust Storm Event (PRISM and USDA)
(2) Characterizing the Dust Storm
Figures 3(a) and (c) provide the spatial distribution of tillage intensity between April 20th and May 3rd in the corn and soybean fields around the area of the dust storm and accident. These tillage maps along with cover crop and main crop planting information are detected by multi-source satellite remote sensing data with highly accurate artificial intelligence models (Wang et al., 2023; Zhou et al., 2024; Zhou et al., 2022). Figure 3(b) presents the erodibility fraction (EROD) derived from the tillage, cover crop and main crop planting datasets over a 9-kilometer spatial resolution. The darker shaded areas indicate more intensive tillage and less cover crop. Figure 3(d) provides the vegetation fraction at the same 9km resolution. The lighter shaded grids have less vegetation and, when coupled with higher EROD cells, the more those areas are susceptible to wind erosion.
Figures 3. Tillage (a & b), Erodibility Fraction (c) and Vegetation Fraction (d) in the Dust Storm Area Fields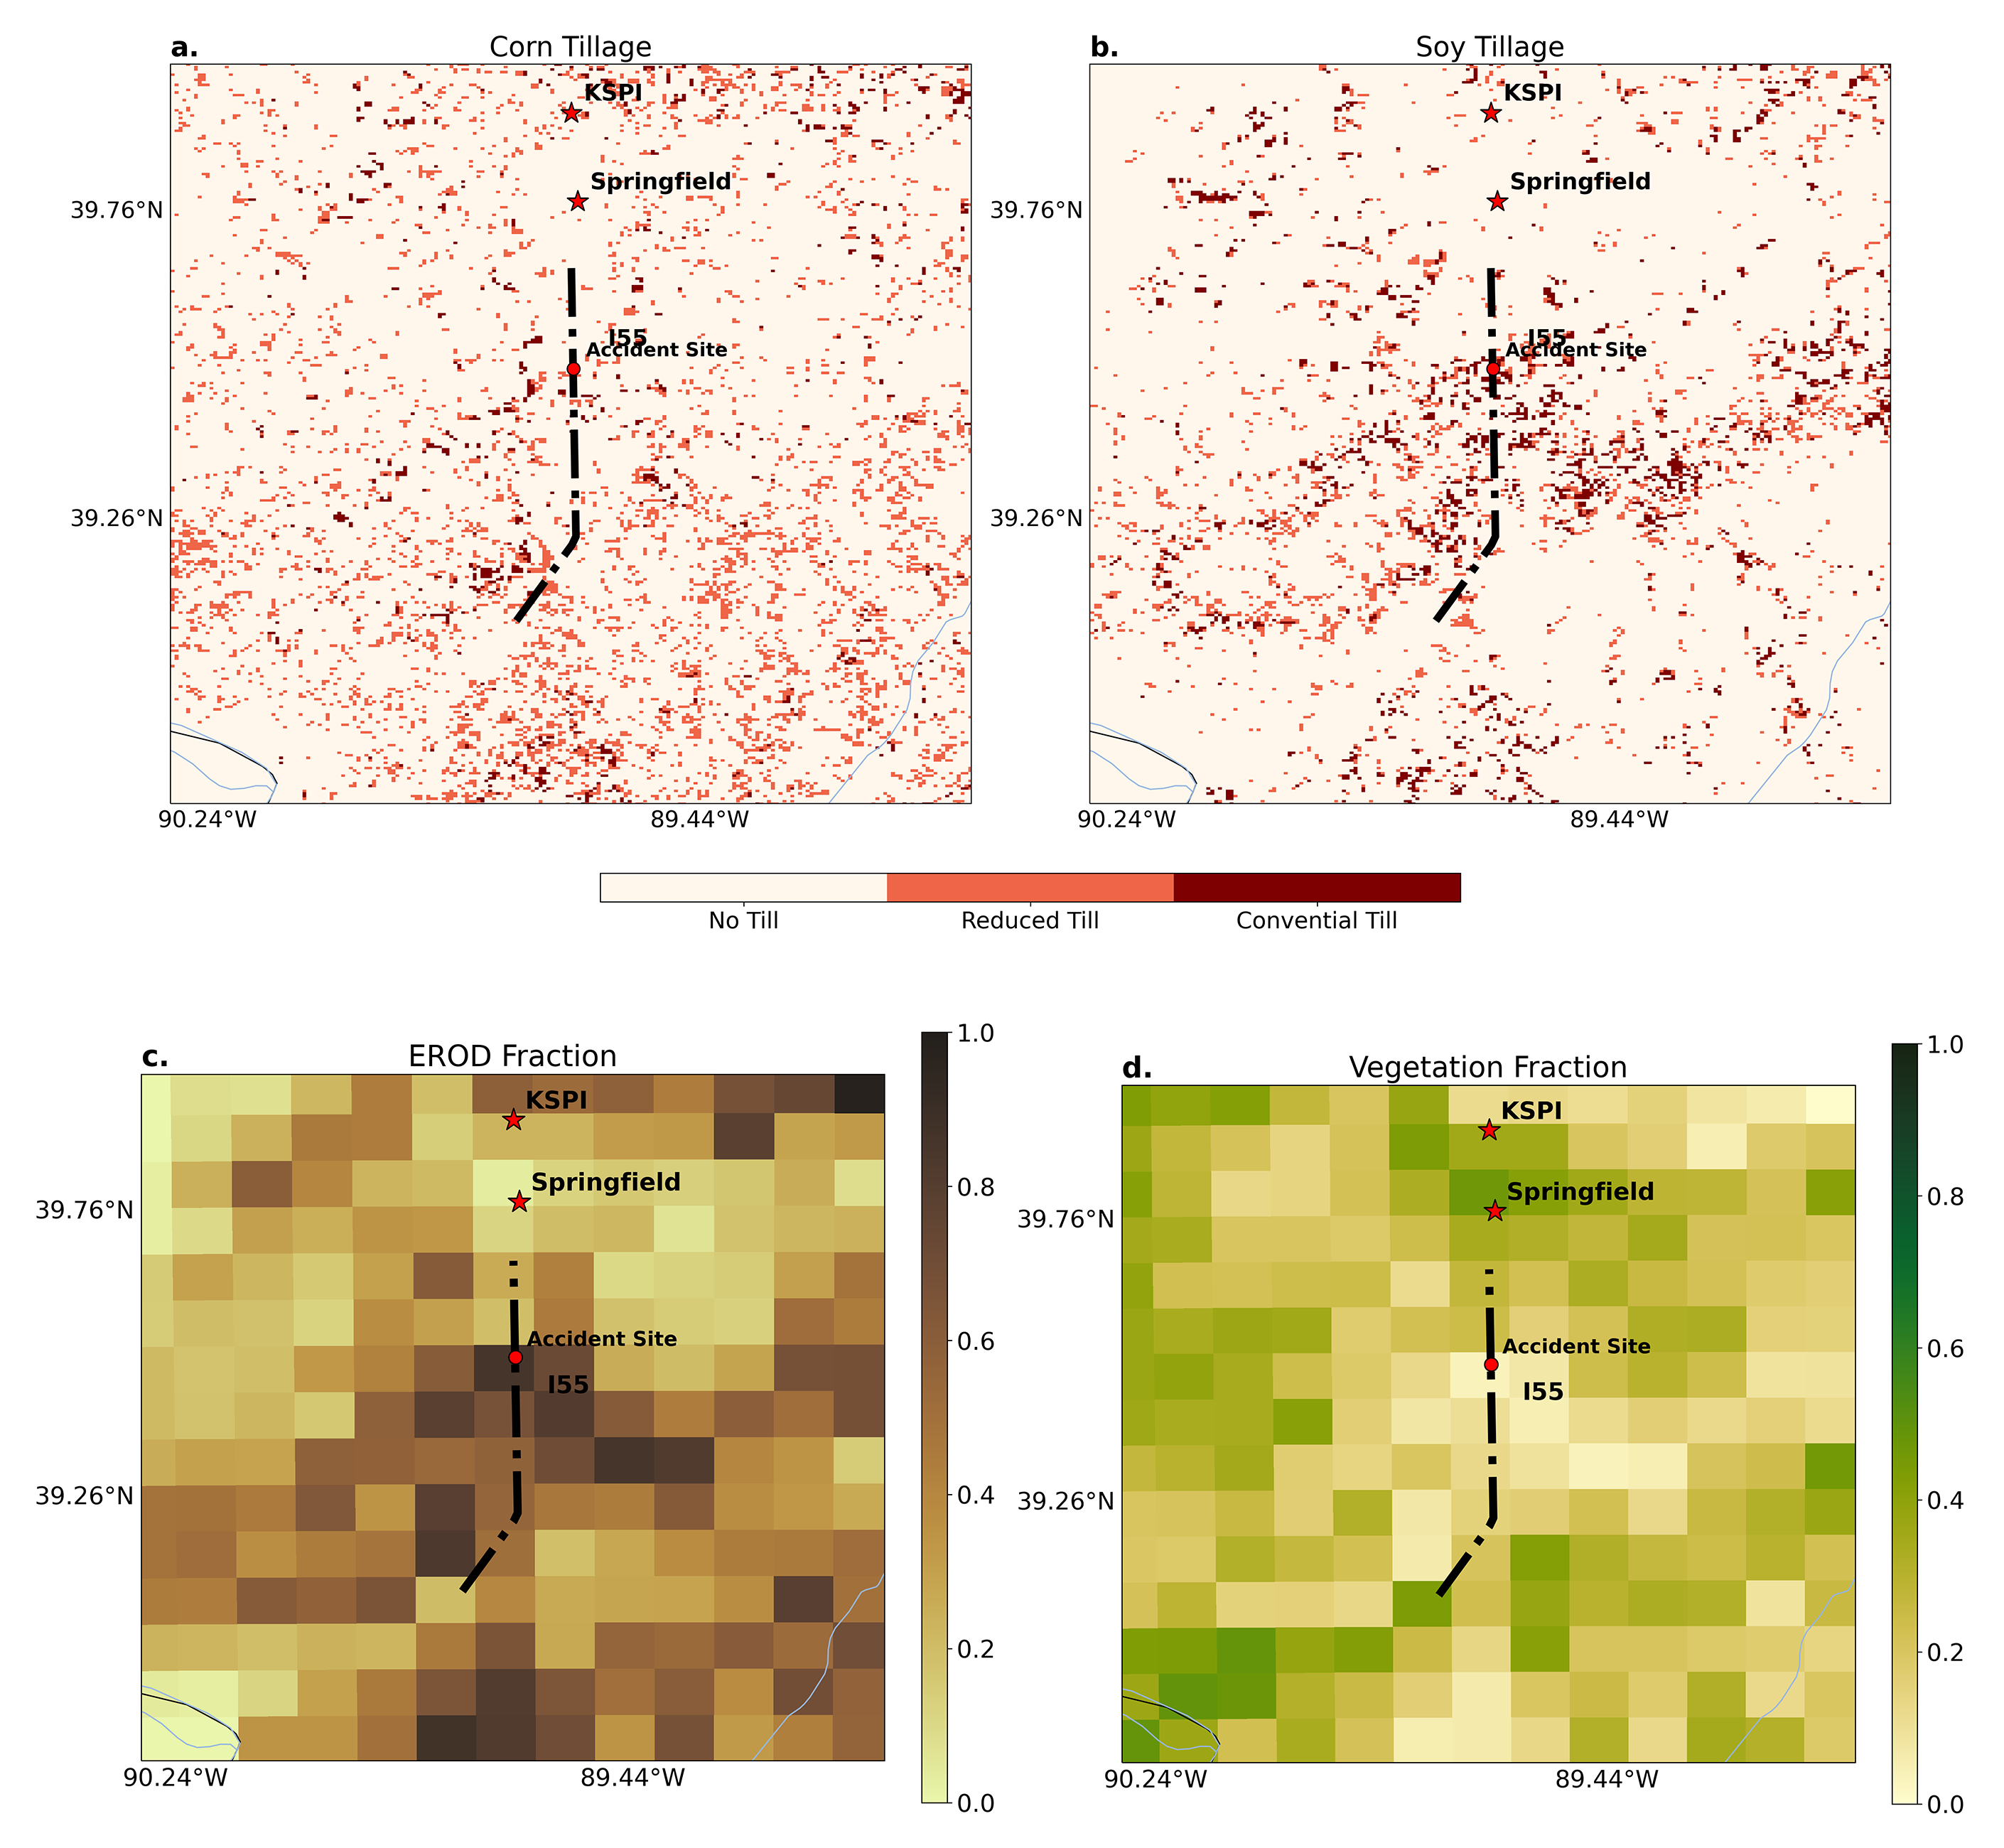
Figure 4 provides an animated model simulation of the dust storm. The first two animated panels are accumulated dust particles and dust concentration simulated by WRF-Chem. WRF-Chem is the Weather Research and Forecasting model that is coupled with chemistry and developed by a collaborative effort led by the National Oceanic and Atmospheric Administration (NOAA) (NOAA, WRF-Chem). The simulation incorporates the EROD parameters illustrated in Figure 3(b). Finally, the third panel (right side) displays the Binary dust location derived from satellite imagery by the Geostationary Operational Environmental Satellites-R Series, a collaborative effort between NOAA and NASA (GOES-R). This provides observational validation of the model simulated dust activity in the first two panels.
Figure 4. Model Simulation and Observation Validation of Dust Storm
Note that the model simulations in Figure 4 begin in the evening of April 30th (7:00 p.m. or 19:00). The middle panel indicates a dust concentration event around 10 a.m. on May 1st, the day of the accident. The model simulates emissions from a dust source north and east near the highway. The dust emission event that begins around 10 a.m. also matches the satellite time and location in the panel on the right and can be compared with the EROD map. The temporal resolution of the model output is at about three hours, which means the timesteps cannot be interpreted as absolute. To match the model timestep, several satellite timesteps were converted into one using the temporal average. Finally, the animated simulation and location are the closest approximations of the storm at this time. A more exact location will require higher resolution model runs.
(3) Characterizing the Concentration of Dust at the Accident Site
Notable in the satellite image of the accident site, a few buildings, ponds and trees are located on the east side of the highway. An additional model replication of the dust storm event indicates a significant concentration of soil particles in the area that was influenced by the trees (green angle) on the east side of the highway (black line). Preliminary results indicate concentration peaks just at two sides of the trees, one of which lies directly over the roadway area and support a conclusion that this peak contributed to the visibility issues. The animation in Figure 5 shows increasing dust accumulation at different heights from the ground, going from 4 meters to 40 meters (the trees are 24 meters height).
Figure 5. Model Simulation of Dust Storm Accumulation at Accident Site
The model simulation produces dust concentration in in two stages. First, through the preferential concentration mechanism—particles tend to leave the regions of high rotation rate and get accumulated in regions of high strain rate (see e.g., Monchaux, Bourgoin, and Cartellier, 2012; Eaton and Fessler, 1994). Second, particles affected by preferential concentration are further influenced by the preferential sweeping effect, which causes inertial particles to settle more rapidly in downward flow regions (see, Tom and Bragg, 2019; Rosa et al., 2016; Good et al., 2014). Together, the model simulation demonstrates how these two mechanisms help explain the observed concentration peaks on the interstate at that location.
(4) Conservation Investments to Address Soil Erosion in Illinois
In Figures 1 and 3, the accident site faces an expanse of open fields with bare soil and a significant amount of tillage to the north and west. One area of questions, among many, that this dust storm incident raises are those involving conservation policy. In the years immediately prior to the dust storm (2019 to 2022), NRCS reports nearly $9.3 billion in financial assistance obligations under the Environmental Quality Incentives Program (EQIP); Illinois received a reported total of almost $119 million (1.28% of the national total). As noted previously, these funds are allocated among hundreds of practices, many of which are not related to addressing soil erosion (farmdoc daily, February 13, 2025). Selecting for those practices most related (or relevant) to addressing soil erosion, the national total from EQIP in those years was $1.4 billion (15.27% of the EQIP total) and Illinois received almost $17.5 million (1.24% of the national total and 14.72% of the State total). Of the four counties most relevant to the dust storm in 2023 (Macoupin, Montgomery, Morgan, and Sangamon), NRCS reported total EQIP obligations of $2.7 million in the years 2019 to 2022, $1.5 million in Macoupin County. Financial assistance for soil erosion practices was even less in those counties, with only Macoupin receiving some ($77,222) and no financial assistance for soil erosion reported for Montgomery (site of the accident), Morgan or Sangamon.
Looking at the Conservation Stewardship Program (CSP), NRCS reported a national total of $3.7 billion from 2019 to 2022, with $155 million (4.15%) going to Illinois farmers. In terms of addressing soil erosion, the national total was $1.6 billion (42.72%), with Illinois farmers receiving almost $96.5 million (6.04%). Soil erosion efforts constituted 62.21% of the Illinois total from CSP. The four counties most relevant to the accident again received little funding: $2.4 million in total CSP ($1.8 million in Macoupin but none in Morgan or Sangamon), $1.9 million for soil erosion ($1.5 million in Macoupin and $410,122 in Montgomery).
Figure 6 seeks to provide context to the reported data by measuring the conservation investments as a percentage of the average crop insurance liabilities for the major crops in 2019 through 2022. Again, this initial measure uses the total financial assistance from EQIP and CSP for soil erosion (2019 to 2022) as a percentage of the average crop insurance liabilities. Montgomery County, Divernon and Springfield are highlighted (the dust storm accident was just south of Divernon in the panhandle area of Montgomery County). Comparatively, Illinois was 0.51% while the National measure was 2.88%.
While inexact, this initial attempt to measure soil erosion conservation investments raises further concern. Not included in the initial measurement is the Conservation Reserve Program (CRP). For example, these four counties are reported to have had a total 43,899 acres (5.33% of total enrolled acres in Illinois) enrolled in CRP in 2022 out of 822,961 in Illinois (3.74% of the national total of enrolled acres) and nearly 22 million nationwide. Future efforts to understand the conservation issue could design a measure that incorporated CRP, as well as acres planted or insured in the counties.
Concluding Thoughts
The bottom line is bare soil. It is always the most critical component for any dust storm. Open fields of bare soil are incredibly vulnerable to the weather. Ongoing research into the tragic 2023 dust storm in Illinois highlights the issue further. Arguably the most interesting finding thus far is not that bare soils under drought conditions and high winds are prone to cause dust storms, but how other features on the land can inadvertently magnify the problem. Initial findings from the research demonstrate how trees, which can form a windbreak but only under the right circumstances, can contribute to a dangerous concentration of dust over a roadway. In a situation where even trees may become a part of the problem, conservation investments in the fields are substantially more important and valuable; stands of trees and other wind breaks cannot be moved to meet the winds and other conditions, obviously, meaning the only real mitigation efforts with a chance to be effective are those that keep soils covered and protected. On this score, the data on conservation financial investments raise further questions and concerns.
References
Coppess, Jonathan. Between Soil and Society: Legislative History and Political Development of Farm Bill Conservation Policy (Lincoln: University of Nebraska Press, 2024). https://www.nebraskapress.unl.edu/nebraska/9781496225146/between-soil-and-society/.
Coppess, J. "Conservation Quandaries, Part 1: Too Much and Not Enough." farmdoc daily (15):28, Department of Agricultural and Consumer Economics, University of Illinois at Urbana-Champaign, February 13, 2025. https://farmdocdaily.illinois.edu/2025/02/conservation-quandaries-part-1-too-much-and-not-enough.html.
Coppess, J. "The Conservation Question, Part 2: Lessons Written in Dust." farmdoc daily (9):200, Department of Agricultural and Consumer Economics, University of Illinois at Urbana-Champaign, October 24, 2019. https://farmdocdaily.illinois.edu/2019/10/the-conservation-question-part-2-lessons-written-in-dust.html.
Cumbie-Ward, Rebecca V., and Ryan P. Boyles. "Evaluation of a high-resolution SPI for monitoring local drought severity." Journal of Applied Meteorology and Climatology 55, no. 10 (2016): 2247-2262. https://doi.org/10.1175/JAMC-D-16-0106.1
Eaton, John K., and J.R. Fessler. "Preferential concentration of particles by turbulence." International Journal of Multiphase Flow 20 (1994): 169-209. https://doi.org/10.1016/0301-9322(94)90072-8.
Egan, Timothy. The Worst Hard Time: The Untold Story of Those Who Survived the Great American Dust Bowl (Boston and New York: Houghton Mifflin Company, 2006). https://www.harpercollins.com/products/the-worst-hard-time-timothy-egan?variant=39936443088930.
Good, G. H., P. J. Ireland, G. P. Bewley, E. Bodenschatz, L. R. Collins, and Z. Warhaft. "Settling regimes of inertial particles in isotropic turbulence." Journal of Fluid Mechanics 759 (2014): R3. https://doi.org/10.1017/jfm.2014.602.
Monchaux, Romain, Mickael Bourgoin, and Alain Cartellier. "Analyzing preferential concentration and clustering of inertial particles in turbulence." International Journal of Multiphase Flow 40 (2012): 1-18. https://doi.org/10.1016/j.ijmultiphaseflow.2011.12.001.
Rosa, Bogdan, Hossein Parishani, Orlando Ayala, and Lian-Ping Wang. "Settling velocity of small inertial particles in homogeneous isotropic turbulence from high-resolution DNS." International Journal of Multiphase Flow 83 (2016): 217-231. https://doi.org/10.1016/j.ijmultiphaseflow.2016.04.005.
Tom, Josin and Andrew D. Bragg. "Multiscale preferential sweeping of particles settling in turbulence." Journal of Fluid Mechanics 871 (2019): 244-270. https://doi.org/10.1017/jfm.2019.337.
Wang, S., Guan, K., Zhang, C., Zhou, Q., Wang, S., Wu, X., Jiang, C., Peng, B., Mei, W., Li, K. and Li, Z., 2023. Cross-scale sensing of field-level crop residue cover: Integrating field photos, airborne hyperspectral imaging, and satellite data. Remote Sensing of Environment, 285, p.113366. https://doi.org/10.1016/j.rse.2022.113366.
Zhou, Q., Guan, K., Wang, S., Jiang, C., Huang, Y., Peng, B., Chen, Z., Wang, S., Hipple, J., Schaefer, D. and Qin, Z., 2022. Recent rapid increase of cover crop adoption across the US Midwest detected by fusing multi‐source satellite data. Geophysical Research Letters, 49(22), p.e2022GL100249. https://doi.org/10.1029/2022GL100249.
Zhou, Q., Guan, K., Wang, S., Hipple, J. and Chen, Z., 2024. From satellite-based phenological metrics to crop planting dates: Deriving field-level planting dates for corn and soybean in the US Midwest. ISPRS Journal of Photogrammetry and Remote Sensing, 216, pp.259-273. https://doi.org/10.1016/j.isprsjprs.2024.07.031.
Disclaimer: We request all readers, electronic media and others follow our citation guidelines when re-posting articles from farmdoc daily. Guidelines are available here. The farmdoc daily website falls under University of Illinois copyright and intellectual property rights. For a detailed statement, please see the University of Illinois Copyright Information and Policies here.