


Recent Population Growth Trends in the North Central United States
In mid-March, the U.S. Census Bureau’s Population Estimates Program released the Vintage 2024 county population estimates.[1] Not only do these estimates show which counties gained or lost population, but they also show the extent to which this population change occurred through natural change (births minus deaths) and migration (domestic and international). These demographic trends can explain much about an area’s economic trajectory. Among other things, significant population loss can lead to declining property values, fewer businesses, and diminished tax bases. Conversely, growing populations can generate new business and work opportunities, greater demand for housing, and a stronger local tax base.
The COVID-19 pandemic disrupted many demographic trends and contributed to higher mortality rates and more limited mobility and migration (White, 2022). This brief focuses on population trends that occurred over the two-year period between 2022 and 2024. It specifically focuses on trends in the 12-state North Central region, and highlights the various population trends that occurred between counties with different economic characteristics and levels of urbanization. [2] It should also be noted that for the Vintage 2024 estimates the U.S. Census Bureau adopted a new method for estimating international migration.[3] Consequently, these estimates better reflect the contributions of international migration to population growth than previous estimates.
The North Central region remains one of the slowest growing parts of the country
Between 2022 and 2024, the U.S. population grew 0.9% annually. The fastest population growth occurred in parts of the South (e.g., Florida, Texas) and the West—especially in many parts of the Intermountain West (e.g., Utah, Nevada, Idaho). The Northeast (particularly NY and PA) and the North Central regions were among the country’s slower growing regions. The North Central region grew 0.5% annually between 2022 and 2024, a rate similar to the Northeast. The North Central region’s three largest states—Illinois (0.4%), Ohio (0.5%), and Michigan (0.5%)—were also among its slowest growing states during this period. The only North Central state that grew faster than the nation—North Dakota (1.0%)—was also the smallest.
Despite the trends, Figure 1 shows that there is great variation both between states, but also within states. Some of the most rapid growth occurred along the coasts and in many of the Sun Belt’s urban areas. By contrast, traditionally disadvantaged regions such as Central Appalachia, the Southern Black Belt, the Mississippi Delta, and parts of the Great Plains experienced the greatest population loss during this two-year period.
Most growth occurred in metro areas, but not in urban cores
Metro areas drive growth throughout the region and the nation. Between 2022 and 2024, U.S. metro and nonmetro counties grew 1.0% and 0.3% annually, respectively. Similar, albeit more modest, population growth occurred within the North Central region’s metro (0.6%) and nonmetro (0.1%) counties. During this period, the North Central region’s fastest growing metro areas included:
- Large metro areas (>1,000,000): Columbus, OH (1.3% annually); Omaha, NE-IA (1.1%); Indianapolis-Carmel-Greenwood, IN (1.1%); and Kansas City, MO-KS (1.0%).
- Medium metro areas (<1,000,000 and >250,000): Des Moines-West Des Moines, IA (1.7%); Fargo, ND-MN (1.6%); Sioux Falls, SD-MN (1.5%); and Madison, WI (1.3%).
- Small metro areas (<250,000): Bismarck, ND (1.2%), as well as university towns such as Columbia, MO (1.1%), Ames, IA (1.0%), Champaign-Urbana, IL (0.9%), and Iowa City (0.9%).
This growth is not only uneven throughout the North Central region, but also within individual metro areas. Figure 2 shows that population trends vary along the urban-rural continuum. With few exceptions (e.g., St. Louis City, MO), most of the region’s large central metro counties added population between 2022 and 2024. This growth resulted primarily from a combination of net international migration and natural increase (i.e., more births than deaths). However, all but one of these counties (Jackson County, MO) experienced net domestic out-migration during this period. In some large central metro counties—Cook County, IL; Ramsey County, MN; Marion County, IN; and St. Louis City, MO—this net domestic out-migration was significant, relative to the overall size of the population.
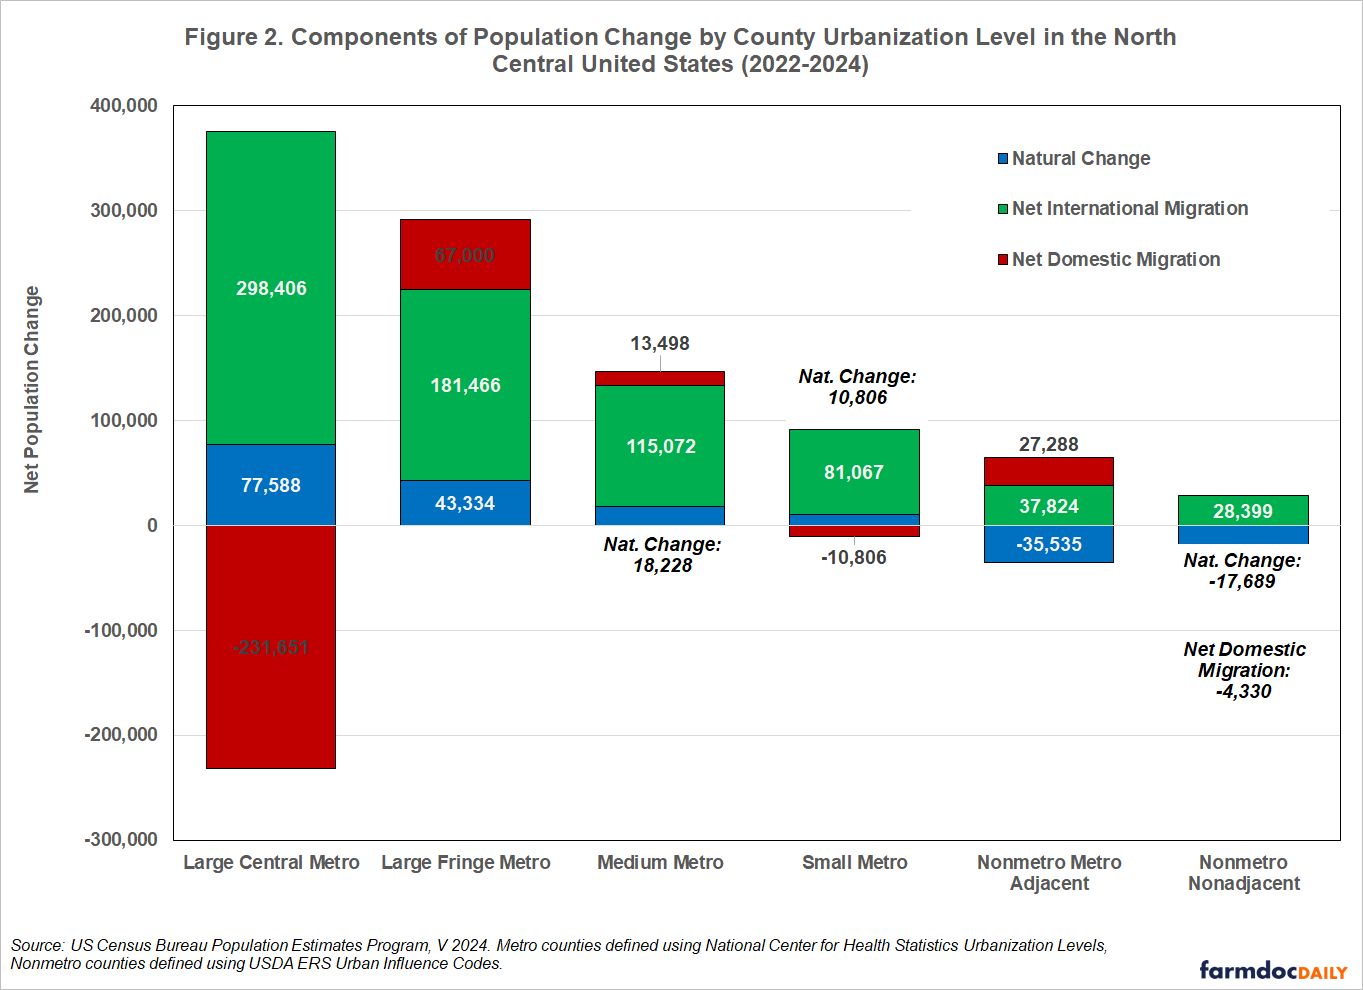
In many instances, people left core metro counties and moved to the surrounding suburban and exurban counties. These trends can be seen in metro areas like Indianapolis where—driven by net domestic in-migration—suburban counties (e.g., Boone, Hancock) grew at a much faster rate than region’s core urban county (Marion County, IN). Similar aggregate patterns occurred in small metro areas, where positive natural change offset the losses occurring from domestic out-migration. As a result, international migration accounted for much of their net population growth.
In nonmetro counties, population growth was often determined by their relative proximity to metro counties. Nonmetro counties adjacent to metro areas benefitted from urban expansion and gained population through net domestic in-migration. Conversely, counties further away from metro areas experienced net domestic out-migration. The North Central region’s more rural counties were also more likely to experience natural decline, as rural populations often have older populations, poorer health, and more limited access to grocery stores and healthcare (Sun and Monnat, 2022). Once again, international migration contributed to these regions’ growth and/or slowed population decline. These populations often make vital contributions to industries such as agriculture and food manufacturing, which are critical economic activities in many rural economies.
Population trends vary among county types
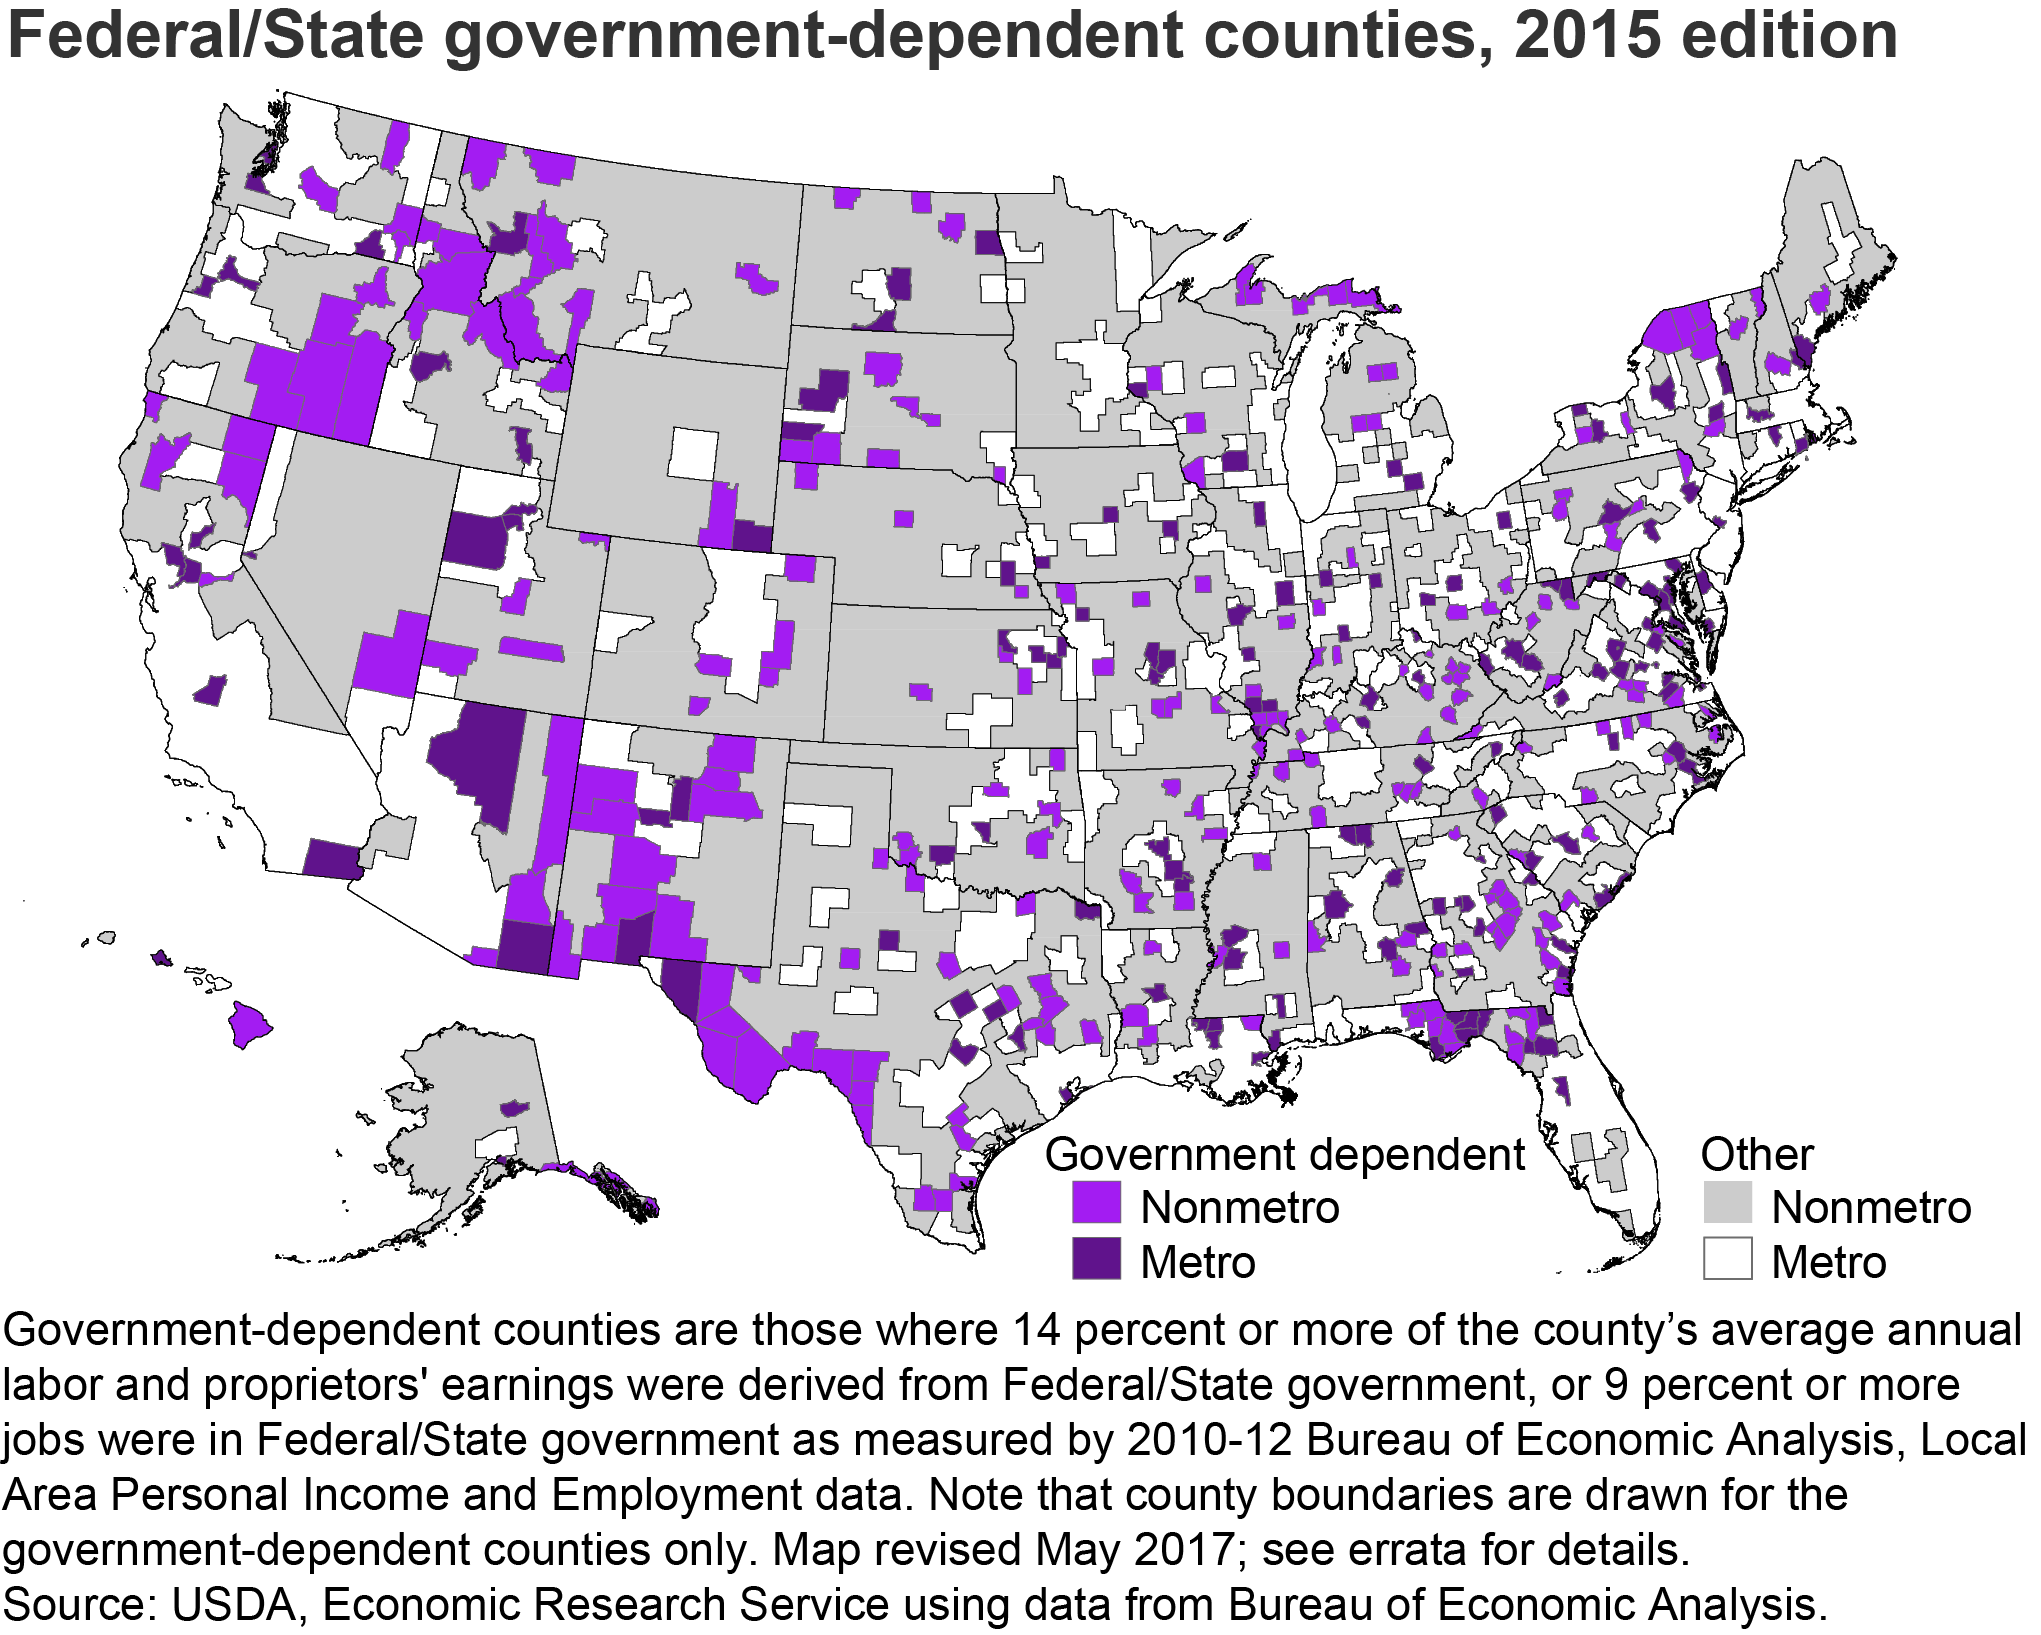
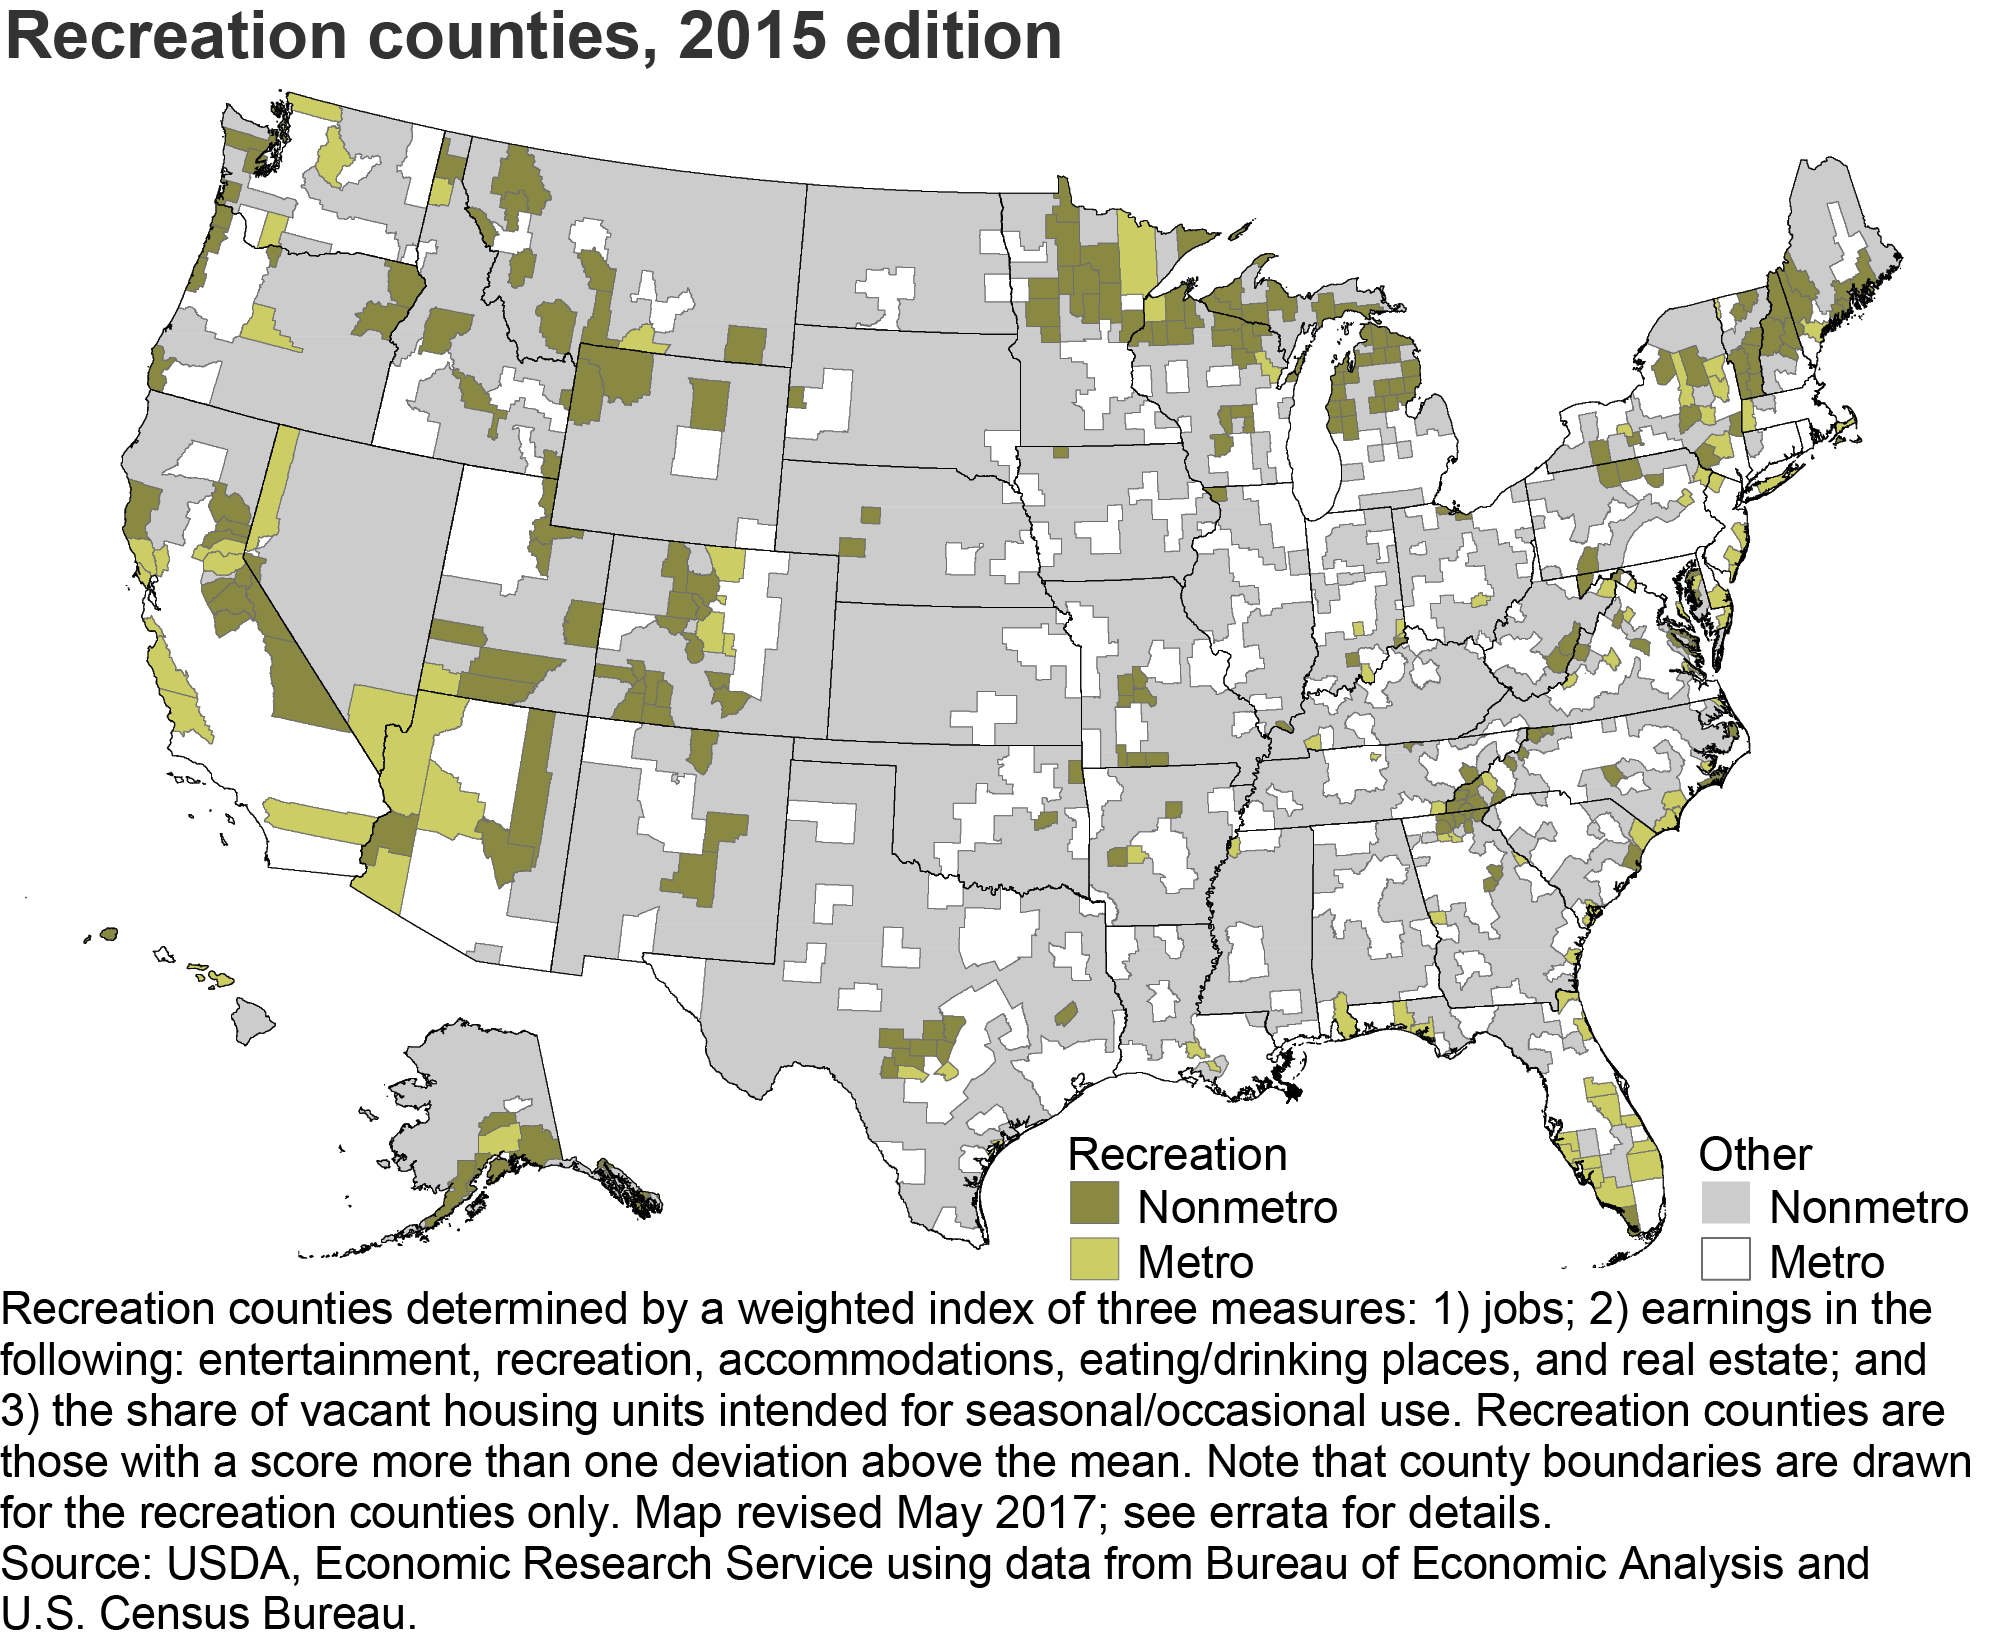
Many factors—employment and educational opportunities, proximity to family, cultural or natural amenities—influence where people choose to live. Given that different types of counties offer different opportunities, this section examines recent population trends through the lens of the USDA Economic Research Services’ County Economic Types.[4] Figure 3 illustrates how population changed between 2022 and 2024 in four types of counties—farming, manufacturing, government, and recreation-dependent—within the North Central region.
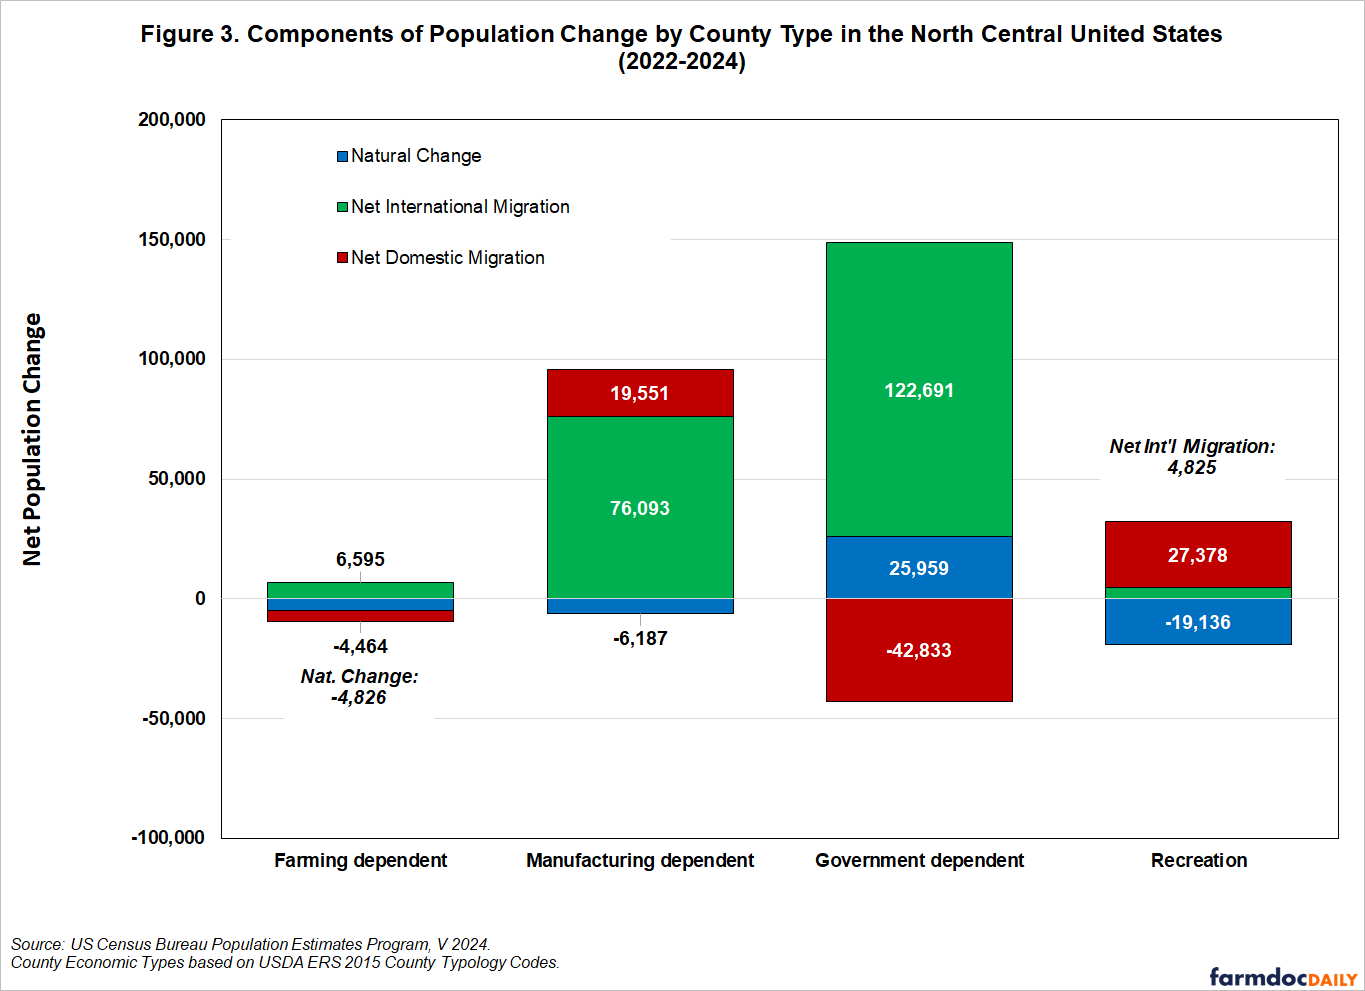
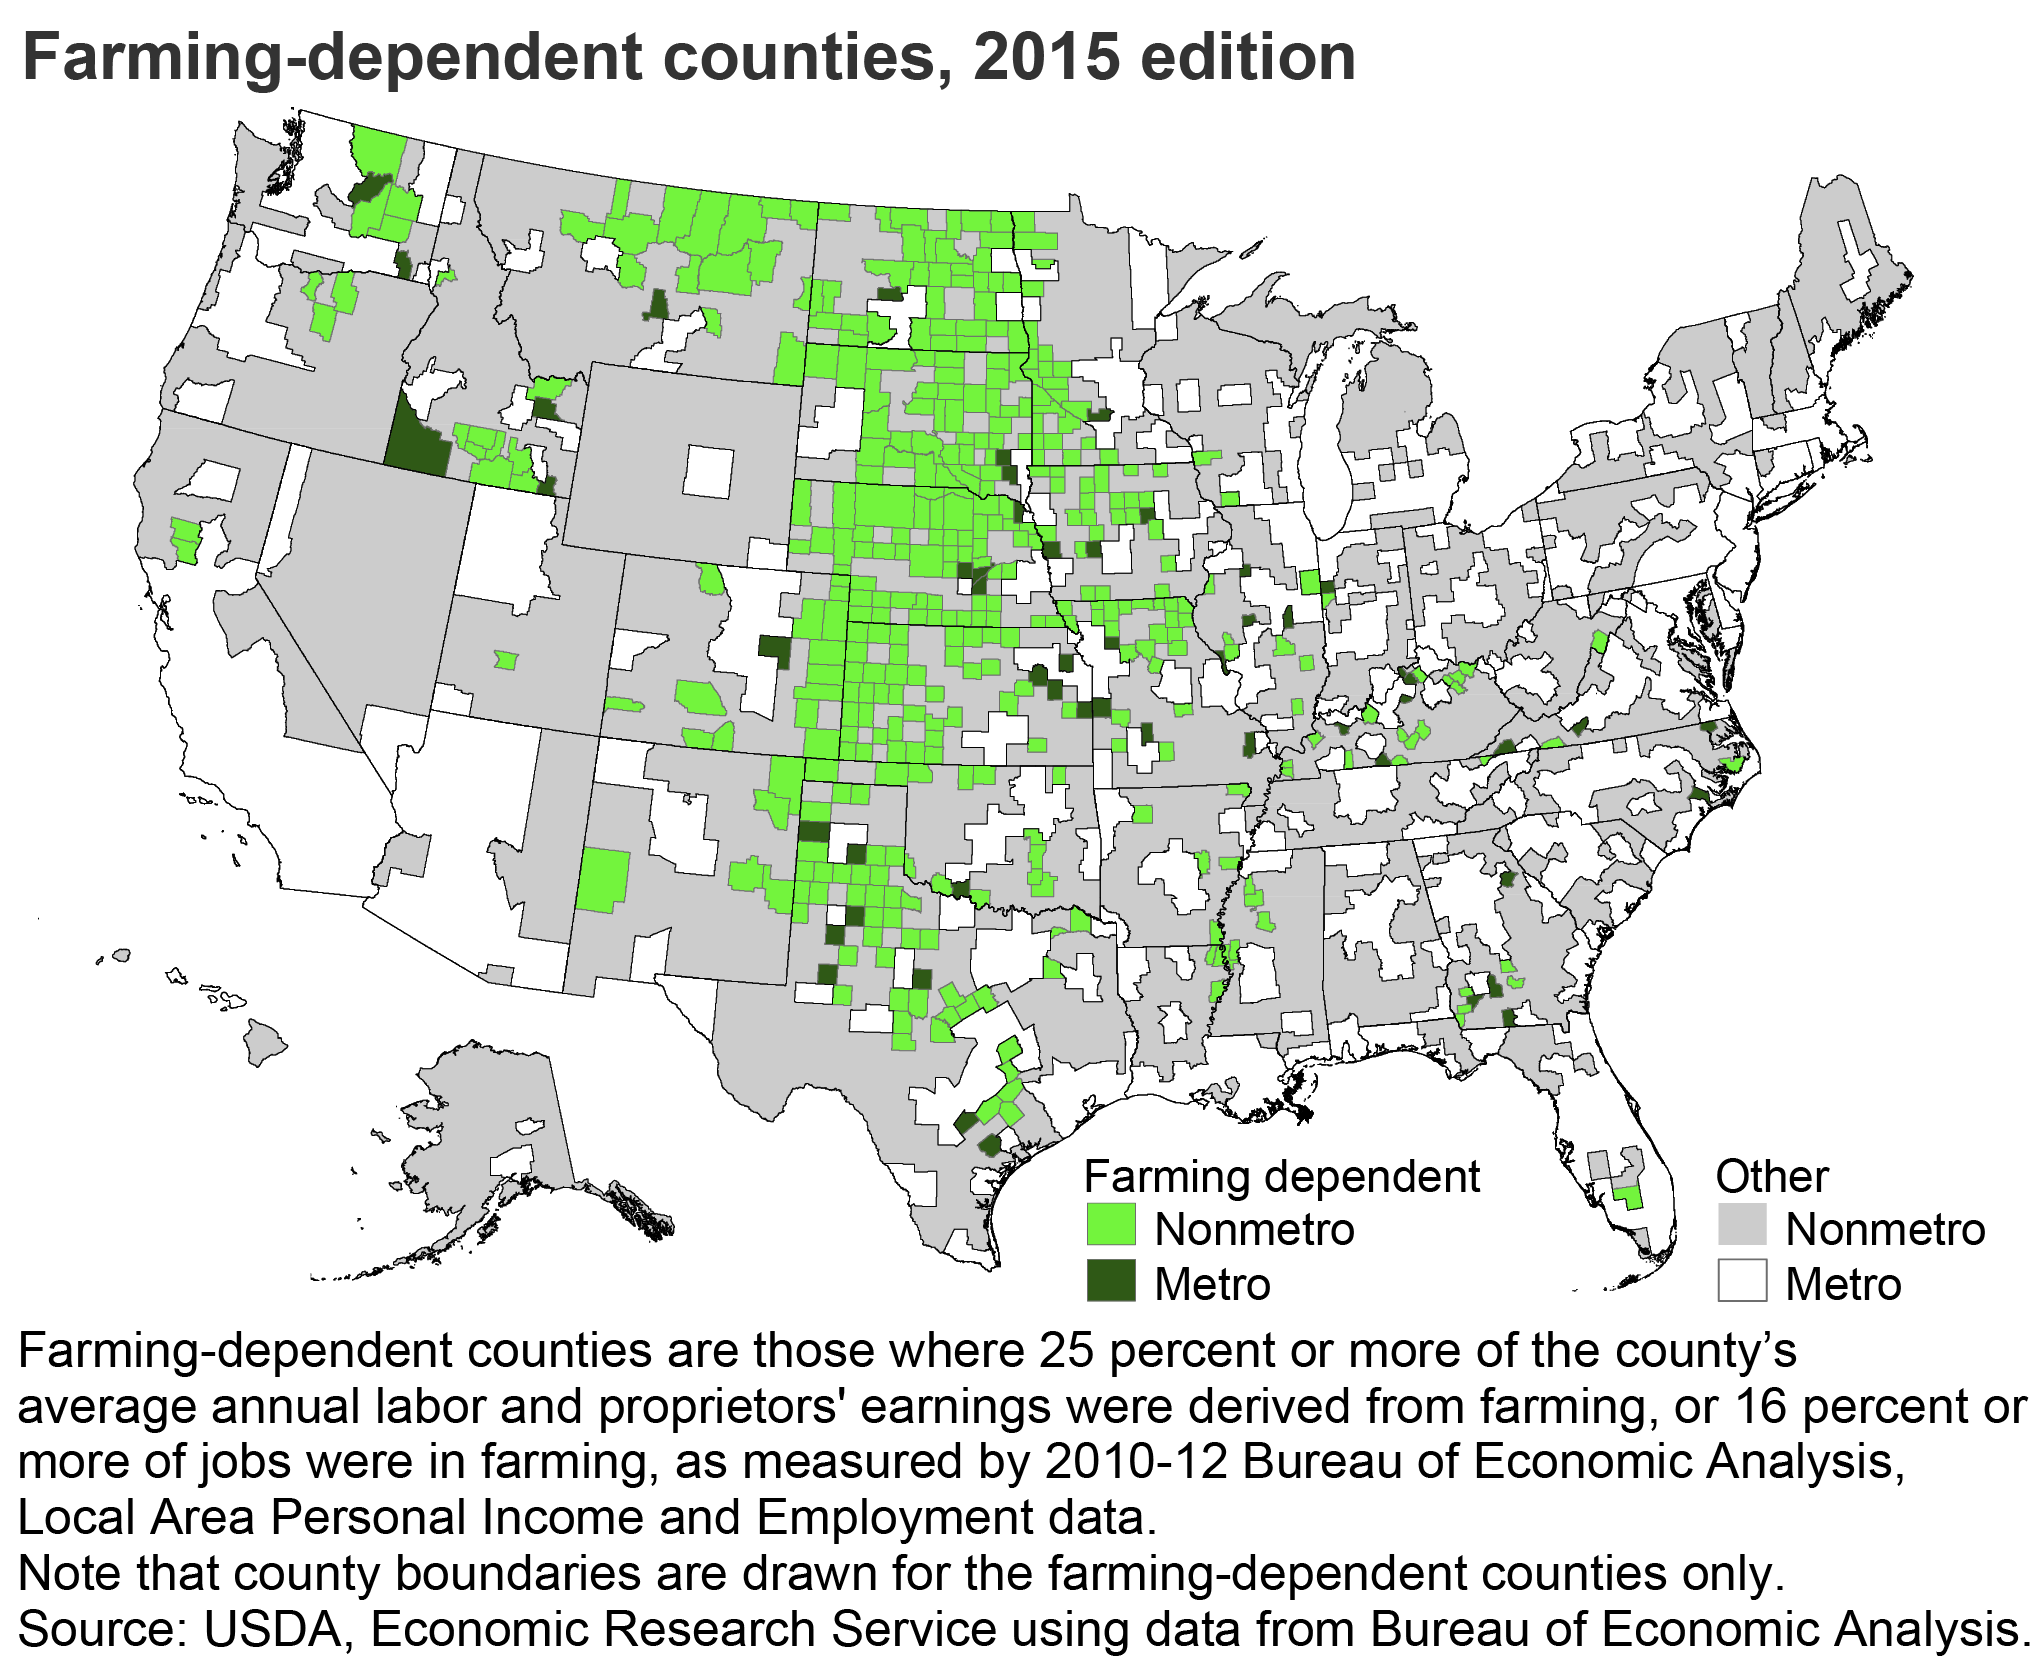
- Farming-dependent counties in the North Central region lost population (-0.1% annually) between 2022 and 2024. The persistent challenges of natural decline and net domestic outmigration contribute to net population loss in farm dependent counties. Domestic migration trends were temporarily reversed during the pandemic (2020 to 2021), in large part because fewer people left these communities, rather than an influx of new residents. The pattern over the past two years (i.e., natural decline and net domestic out-migration) is more consistent with more the population trends that occurred in the two decades preceding pandemic.
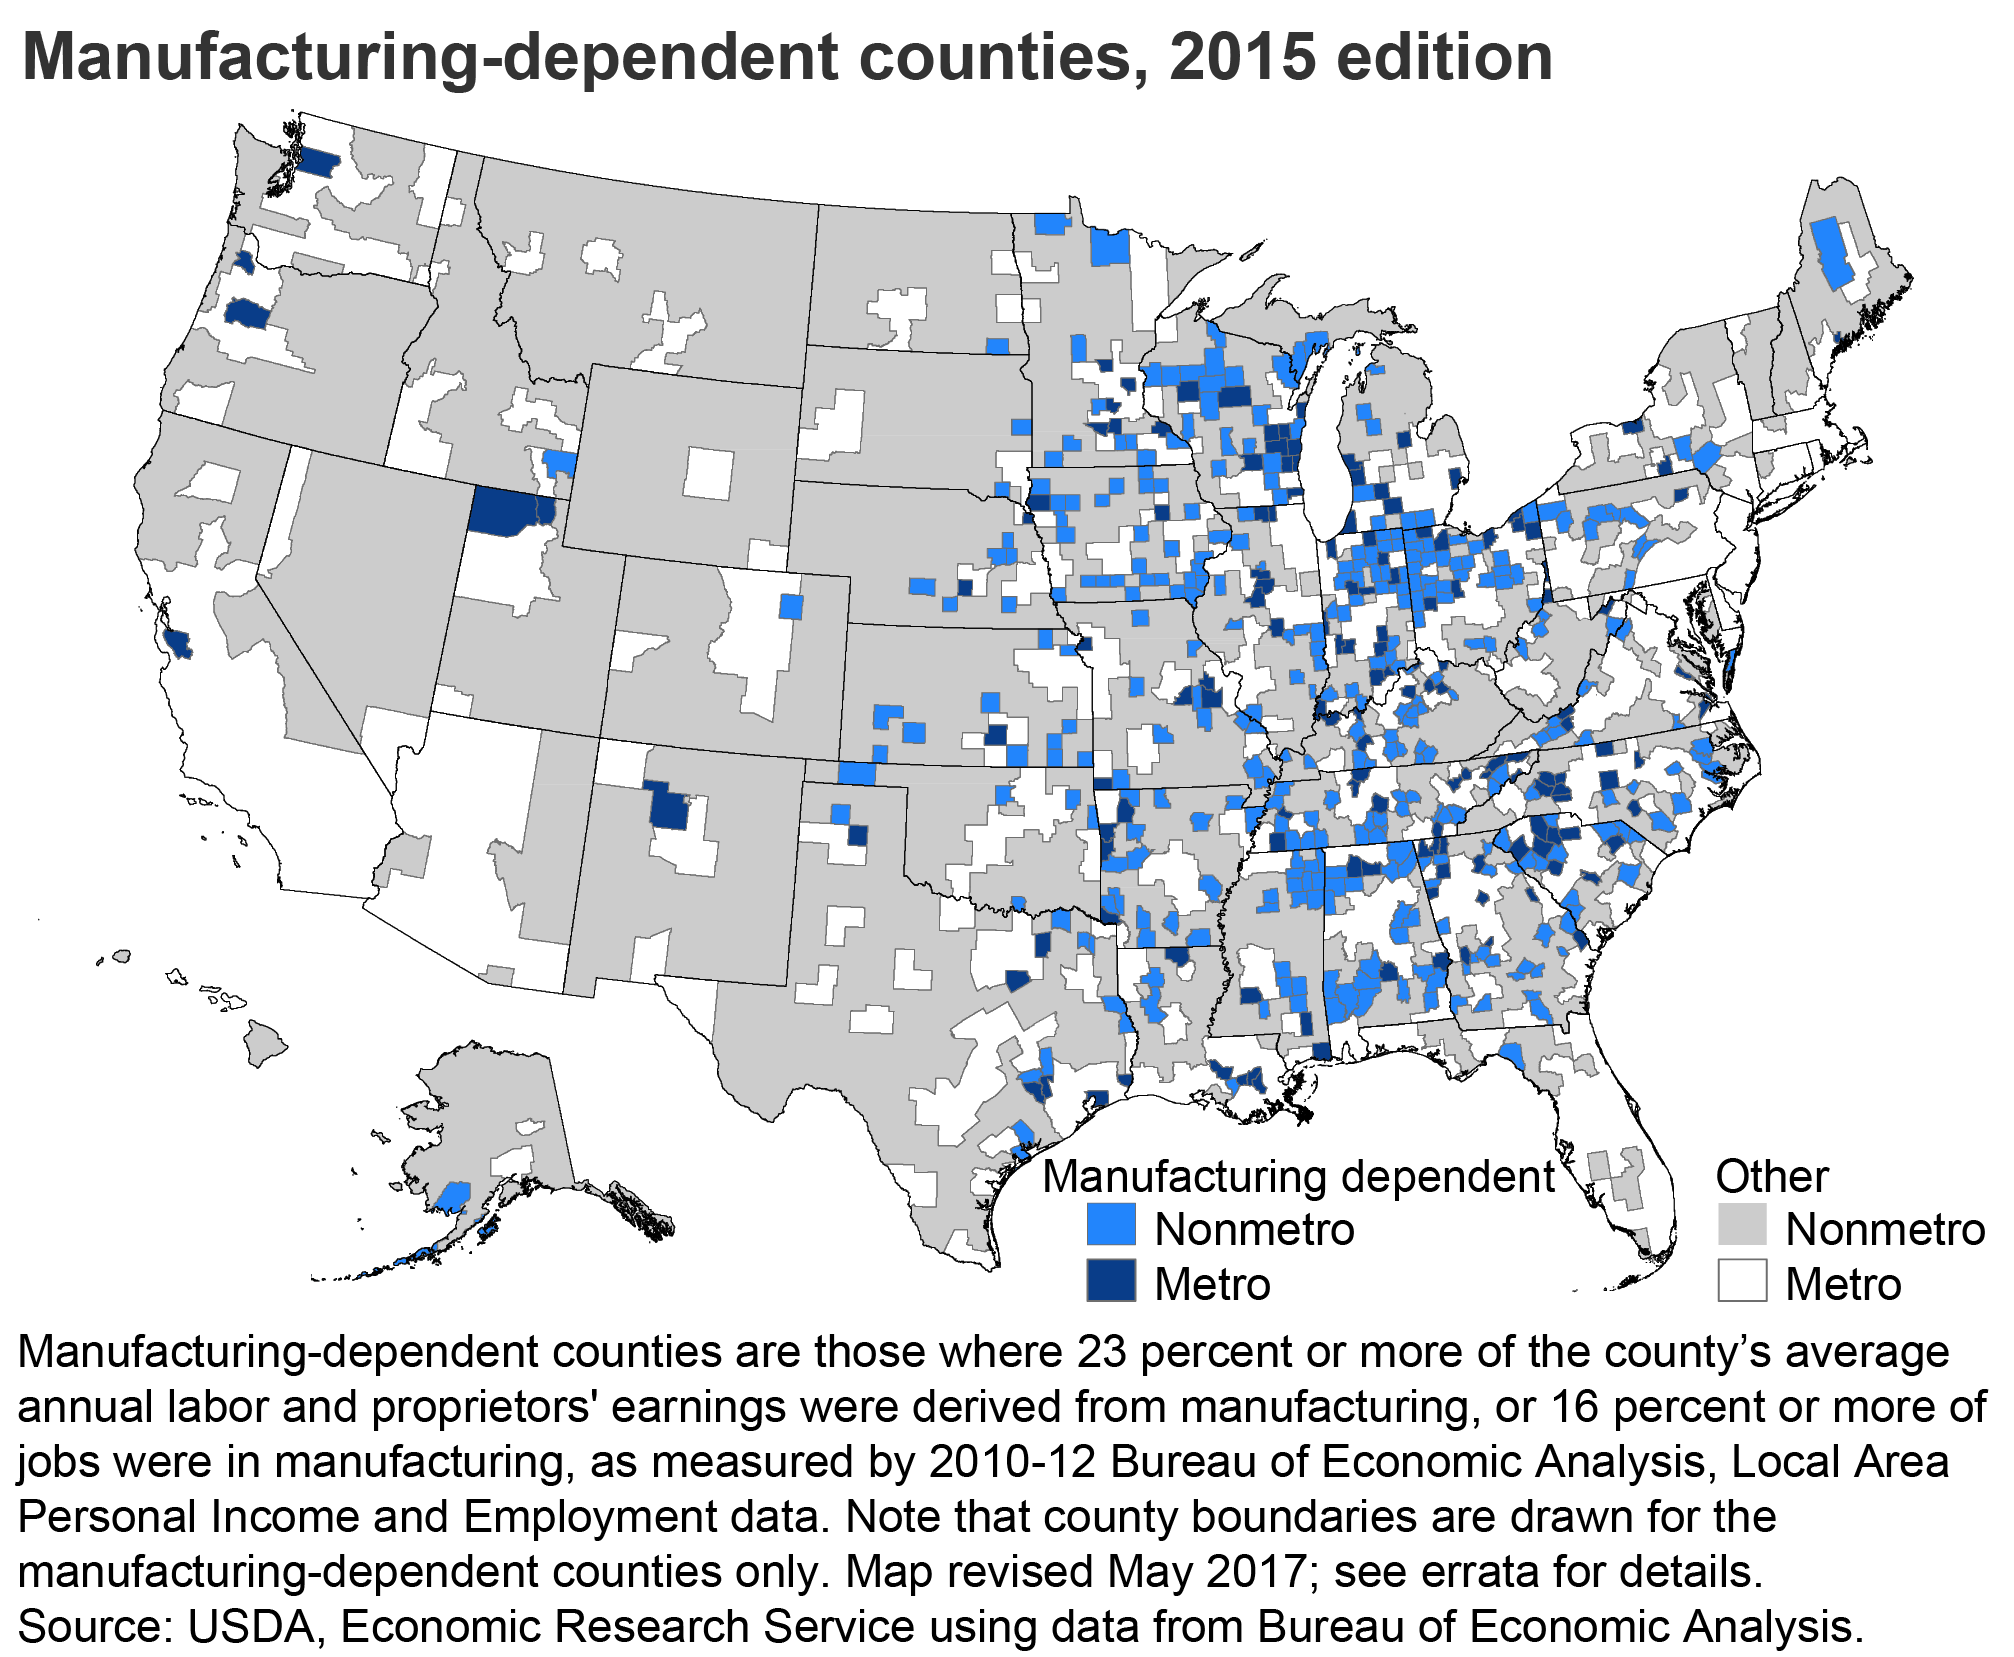
- The North Central region’s Manufacturing-dependent counties benefitted from both international and domestic in-migration over the past two years. As a result, they grew 0.4% annually between 2022 and 2024. Even though births and deaths were largely even in manufacturing-dependent counties nationwide, these counties in the North Central region experienced natural decline due to the region’s relatively older population.
- Government-dependent counties include those with notable public schools and universities, military bases, prisons, or other significant state and federal government activities. Overall, these counties grew 0.8% annually between 2022 and 2024. Within the North Central region, many of the fastest growing government-dependent counties were home to a large public university including Athens County, OH (Ohio University), Dane County, WI (University of Wisconsin), and Story County, IA (Iowa State University). International migration—which had been significantly reduced during the pandemic (2020 to 2021)—contributed to much of this recent growth.
- Nationally, Recreation-dependent counties grew four times faster (1.2% annually) the North Central region’s recreation counties (0.3% annually) between 2022 and 2024. Nationwide, many of these counties are coastal and/or retirement destinations (e.g., Florida, Arizona). Within the North Central region these counties are more seasonal destinations and often the places with relative high numbers of second homes. Recreational and natural amenities draw new residents, but deaths still outnumber births in these counties which indicators that new residents are often older in nature (i.e., retirees, pre-retirees).
Some population trends have returned to pre-pandemic patterns, but other challenges may lie ahead
Compared to the nation as a whole, the North Central region continues to experience relatively slow growth. Metro areas drive this growth, but it occurs more in suburban and exurban counties rather than the urban core. Various factors, such as housing availability and school quality, explain these patterns. The adoption of hybrid work arrangements (rather than purely remote work) allows some workers to live near their workplaces without commuting every day. Although some employers are bringing their workforce back to the office, these new work arrangements persist. The U.S. Bureau of Labor Statistics’ American Time Use Survey showed that in 2023, 35 percent of workers worked at home (full or part-time, scheduled or unscheduled), compared to 24 percent in 2019 before the pandemic. The persistence of hybrid work arrangements will continue to provide many workers with more options on where to live.
Unlike the pandemic years, the past two years have experienced lower mortality rates and increased mobility. The latest population estimates also better reflect international migration, showing it as a much larger factor in growth than previous estimates. With changing U.S. politics, immigration limitations could significantly impact urban areas, farming communities, and college towns.
Notes
[1] The U.S. Census Bureau produces these estimates annually to show intercensal population trends and the components of population change (e.g., natural change, net migration). For each year, these estimates measure the population change from July 1 to June 30. They use the Decennial Census as benchmark, so the 2020 estimates are very close to the Census population counts. With each annual release, the Population Estimates Program revises and updates the entire time series back to the previous Decennial Census. As a result, each new Vintage supersedes previous vintages. As a result, the trends described here should not be directly compared to the findings derived from previous vintages (e.g., White, 2022) . Readers should also remember that these data are estimates, although the Census Bureau uses the best data and methods available to them.
[2] The North Central region is defined here as the states of Illinois, Indiana, Iowa, Kansas, Michigan, Minnesota, Missouri, Nebraska, North Dakota, Ohio, South Dakota, and Wisconsin.
[3] For the Vintage 2024 estimates, the Census Bureau combined information from the American Community Survey, as well as administrative data that tracks things like lawful permanent residents, visa issuances, and international student enrollees, among other things. More information about this methodological change is available on the Census website: https://www.census.gov/newsroom/blogs/random-samplings/2024/12/international-migration-population-estimates.html
[4] USDA ERS’ 2015 County Typology Codes classify all U.S. counties into six mutually exclusive categories of economic dependence. Figure 3 focuses on the population trends in four of the six different types of counties. Two others—mining-dependent and non-specialized—were not included. The North Central region possesses relatively few mining-dependent counties (e.g., Missouri’s Lead Belt, Bakken Oil Fields in North Dakota) and almost all of them are small nonmetro counties. Nonspecialized counties are often found in the region’s metro areas. More information about the county typology codes can be found on the USDA ERS website: https://www.ers.usda.gov/data-products/county-typology-codes/
References
National Center for Health Statistics. (2014) 2013 NCHS Urban-Rural Classification Scheme for Counties. U.S. Department of Health and Human Services. https://www.cdc.gov/nchs/data/series/sr_02/sr02_166.pdf
Sun, Y. and Monnat, S. (2022) “Rural-urban and within-rural differences in COVID-19 vaccination rates.” The Journal of Rural Health. 38: 916-922. https://doi.org/10.1111/jrh.12625
White, M. "Post-Pandemic Population Trends in the North Central United States." farmdoc daily (13):84, Department of Agricultural and Consumer Economics, University of Illinois at Urbana-Champaign, May 9, 2023.
Disclaimer: We request all readers, electronic media and others follow our citation guidelines when re-posting articles from farmdoc daily. Guidelines are available here. The farmdoc daily website falls under University of Illinois copyright and intellectual property rights. For a detailed statement, please see the University of Illinois Copyright Information and Policies here.