Self-Insurance by US Farmers
Self-insurance is an important tool businesses use to manage the financial consequences of their risks. Sources of farm self-insurance include financial assets, crop stocks, and animal inventories. Farm financial assets relative to cash farm production costs have exhibited no trend over the last 50 years. This 50-year period suggests farmers aim for financial assets between 30% and 35% of cash production expenses. The current share is 30%. Value of crop stocks and animal breeding herds have declined notably relative to cash receipts. These declines began prior to the growth in Federally-subsidized crop and animal insurance; suggesting declining self-insurance was likely a key factor in the growth of Federally-subsidized insurance. Since 2012, self-insurance has declined as use of subsided insurance has grown. This negative relationship raises the policy questions, “Are Federal subsidies crowding out self-insurance?” and “What is the optimal mix of self-insurance and public insurance subsidies?”
Liquid Farm Assets as Self-Insurance
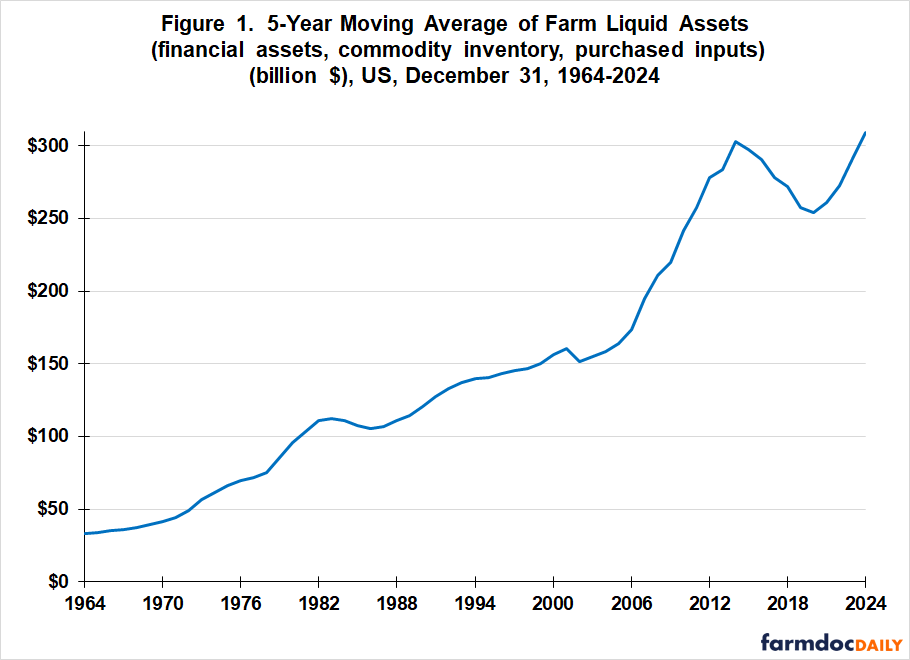
While definitions vary, almost all definitions of business self-insurance include liquid assets. Liquid assets are assets that can be readily converted into cash. Liquid farm assets include the farm’s financial assets as well as crop and livestock inventories. We also include purchased inputs since they no longer need to be bought. Data on these four liquid assets are available from the Farm Income and Wealth database maintained by USDA, ERS (US Department of Agriculture, Economic Research Service). Values are as of December 31. This study starts with 1960, the first year data on financial assets are available. Data on purchased inputs do not start until 1984, but purchased inputs have at most been 10% of liquid assets. Five year averages are computed to focus on longer-term trends by smoothing year-to-year variation. Thus, 1964 is the first year discussed in this study.
The sum of the four liquid assets held by all US farms increased from 1964 through 2013, the end of the crop prosperity period that started in 2007 (see Figure 1). The fastest increase occurred during the 2007-13 period of crop prosperity. Since 2013, liquid assets have declined from $300 to $250 billion, then returned to the 2013 high of $300 billion.
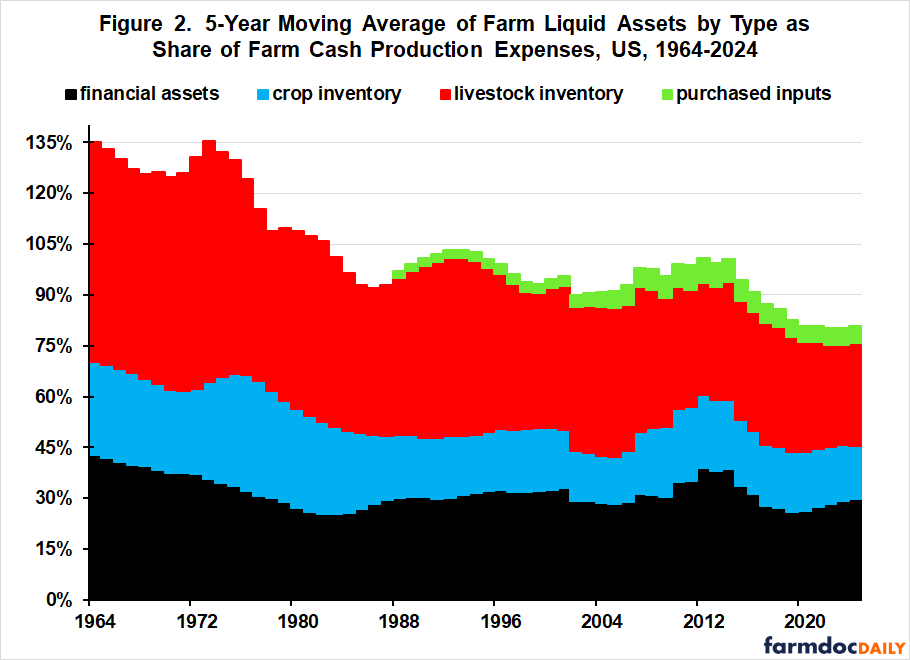
A primary use of farm self-insurance is to ensure that the farm can continue if an untoward event occurs. A more insightful measure of self-insurance is therefore liquid assets as a share of cash production expenses. By this measure, self-insurance of all US farms has declined. Liquid assets exceeded cash production expenses by 35% during the early 1960s (see Figure 2). They are currently 20% below cash expenses. Most of the decline occurred in the 1970s / early 1980s and post 2012. Purchased inputs are the only type of liquid assets that have not declined as a share of cash expenses. Since 2000, they have averaged 6% of cash farm expenses. The other liquid assets are discussed in the next sections.
Financial Assets
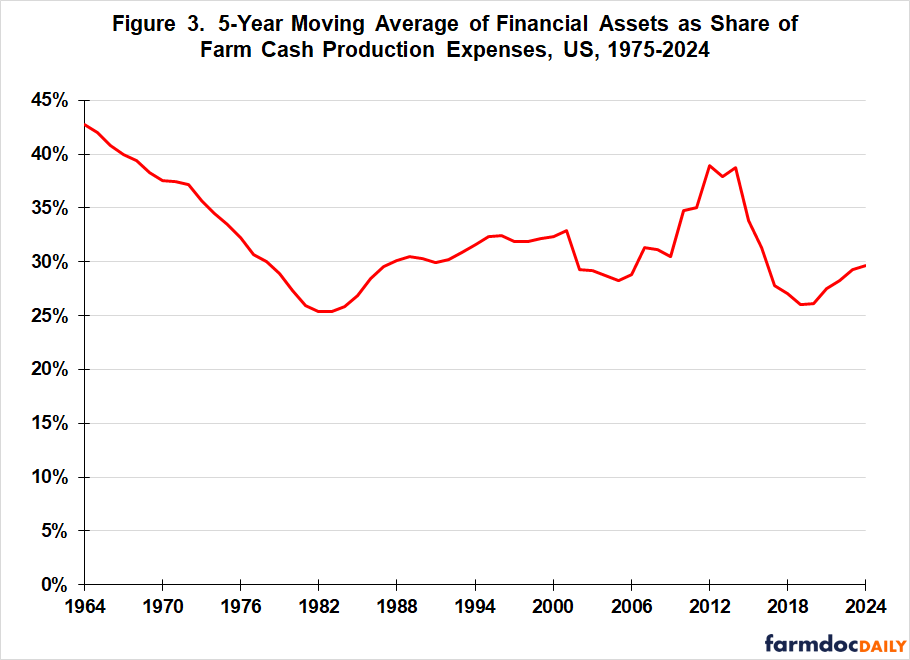
Financial assets as a share of US farm cash production expenses declined steadily from 43% in the early 1960s to 25% at the start of the farm financial crisis in the early 1980s (see Figure 3). US farms quickly rebuilt financial assets to 30% by 1988, then progressively continued to increase them. By the end of the 2007-13 crop prosperity period, the ratio was nearly 40%. After tumbling to near its historical low of 25% by 2020, the ratio once again quickly returned to 30%, which is just below the post-1970 average of 31%. This historical review suggests US farms aim for financial assets that are between 30% and 35% of their cash farm production expenses.
Crop Stocks
It would be desirable to relate the value of crop stocks to cash crop production expenses, especially given the specialization in grain and livestock production that has occurred over the last 50 years. USDA, ERS however does not report cash production expenses by crop and animal production. Value of US crop stocks is thus discussed relative to US cash crop receipts.
The ratio of crop stocks on December 31 to cash crop receipts for the year declined rapidly in the 1980s. This decline coincided with a policy objective, especially in the 1985 Farm Bill, to reduce Federal spending on storing crops. Public stock programs at that time included the Farmer-Owned Reserve (FOR), which subsidized on-farm storage of crops. Most public storage programs, including FOR, were ultimately terminated / suspended by the 1996 Farm Bill.
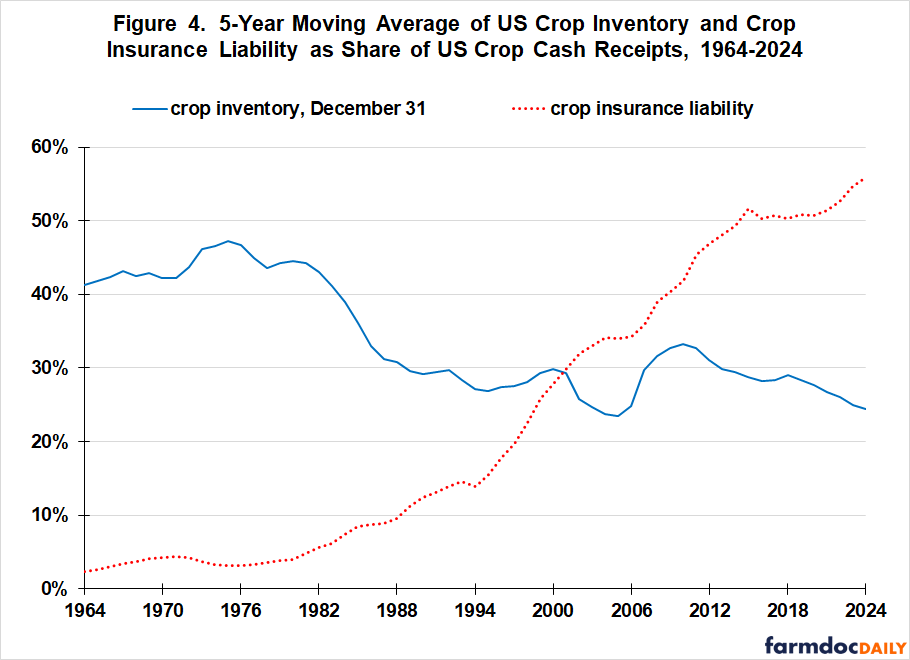
Crop insurance dates to the Agricultural Adjustment Act of 1938, but was a small program until Federal premium subsidies and private delivery were instituted in 1981. Use of crop insurance, as measured by insured liability relative to crop cash receipts, began to increase as stocks of crops and Federal spending on storing crops declined in the 1980s (see Figure 4). It may be coincidence, but to the authors’ knowledge, the potential connection between increased use of Federally-subsidized crop insurance and decline in government crop storage programs has not been previously noted. It seems reasonable that use of crop insurance would increase as self-insurance via crop stocks declined.
The growth in crop insurance has more than offset the decline in self-insurance via crop stocks. Their combined value currently exceeds 80% of US cash crop receipts vs. 40% to 50% in the 1960s and 1970s. Especially since 2000, crop farms’ unprotected exposure to risk has declined substantially. Note that crop insured liability does not contain the liability insured with rainfall insurance. Rainfall insured liability is included as part of livestock insured liability (see next section).
Between 1985 and 2012, the growth in crop insurance liability as a share of crop cash receipts was associated with no change in crop inventory as a share of crop cash receipts. However, since 2012, crop inventory as a share of crop cash receipts has declined by 6.7 percentage points (from 31.1% to 24.4%) while crop insurance liability as a share of crop cash receipts has increased by 8.9 percentage points (from 47.0% to 55.9%). The two post-2012 trends prompts the question. “Are Federal crop insurance subsidies crowding out crop farm self-insurance?”
Animal Inventory
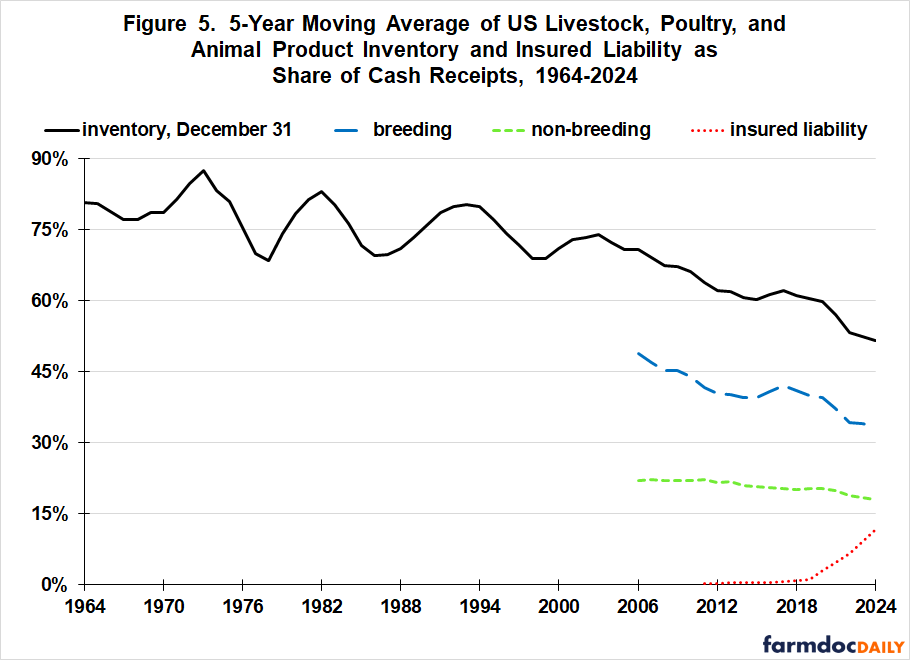
From the early 1960s to 2005, the ratio of livestock, poultry, and animal product inventory on US farms on December 31 to cash receipts from livestock, poultry, and animal product sales trended slightly downward with well-defined cycles whose amplitudes also declined (see Figure 5). Since 2005, the cycles have largely disappeared and the downward trend has accelerated to one percentage point per year, dropping from 71% to 51%.
ERS began reporting animal inventory by breeding and non-breeding categories in 2002. Since then, the ratio of both breeding and non-breeding herds on December 31 to animal cash receipts has declined (see Figure 5). A primary, but not only, reason for the much larger decline in breeding herd ratio is the increasing ratio of consumable animal product to a livestock species’ foundation herd, i.e. the breeding stock that produces animals that produce farm output (see farmdoc daily of May 24, 2019). Sheep are an exception. Hogs, dairy, and broilers have experienced especially large increases in this production efficiency measure. The ensuing large decline in animal breeding herds reduced their self-insurance value for animal producers. The decline in breeding herd self-insurance preceded, then coincided with the increased use of animal insurance, especially since 2018. Animal insurance is measured as the insured liability of rainfall insurance plus livestock insurance.
In assessing animal inventory as self-insurance, it is important to note that breeding herds of hogs and especially broilers and layers have concentrated in production integrators. In 2022, independent producers sold 35% of all hogs in the US (2022 Census of Agriculture). Contractors or integrators sold 23% while contract growers (contractees) sold 42%. Contracting notably alters the amount of self-insurance needed by producer type. In summary, the role and need for self-insurance across producer type in a given animal species’ production system likely reflects the distribution of production risks across producer type.
Discussion
Self-insurance is an important business tool that farmers use to manage the financial consequences of the risks they confront, including weather and disease that can cause large reductions in output.
Data for the last 50 years suggest that, when farm financial assets fall below 30% of cash farm expenses, the ratio returns quickly to a range between 30% and 35%. This behavior has occurred at different times, suggesting a farmer managerial benchmark is farm financial assets equal to 30-35% of farm cash expenses. While an observed behavior and not conceptually-derived, farmers likely know better than anyone else what is prudent management for their farm to survive over time.
Currently, the financial asset ratio for US farms is 30%, implying a likely contemporary objective of US farmers as a group is to increase financial assets as a share of cash farm expenses.
Crop and animal inventories are other key components of farm self-insurance. They have declined as a share of crop and animal cash receipts, indicating a reduction in farm self-insurance. The initial decline preceded the increased use of both crop and animal off-farm insurance. This temporal relationship occurred at distinctly different times for crops and livestock, suggesting off-farm insurance filled an insurance void stemming from a decline in on-farm self-insurance via output inventories.
Public policy decisions to reduce Federal spending for storing crops and increase Federal spending for crop insurance occurred at roughly the same time in the 1980s. This may be coincidence, but it also seems reasonable that declining self-insurance would increase interest in off-farm insurance.
It is not unreasonable to argue that the existence of Federal subsidies for crop insurance provided a key rationale for extending Federal subsidies to animal insurance as self-insurance by animal farms declined in response to improving production efficiency of foundation breeding herds. Extension of existing public policy tools / programs to new areas commonly occurs in public policy.
Self-insurance remains an important farm management tool in the presence of Federal insurance subsidies. The decline since 2012 in self-insurance via animal and, especially crop, inventory as use of Federally-subsidized insurance increased prompts an important policy question, “What is the optimal mix of self-insurance and public insurance subsidies?” This question has received little attention in recent years. The lack of attention as farm self-insurance declines and public subsidies for insurance grow suggests it may be time to visit the question.
References and Data Sources
US Department of Agriculture, Economic Research Service. March 2025. Farm Income and Wealth Statistics: February. https://www.ers.usda.gov/data-products/farm-income-and-wealth-statistics/
US Department of Agriculture, National Agricultural Statistics Service. March 2025. 2022 Census of Agriculture. https://www.nass.usda.gov/AgCensus/
Zulauf, C. “Comparing Livestock Productivity Since 1993.” farmdoc daily (9):96, Department of Agricultural and Consumer Economics, University of Illinois at Urbana-Champaign, May 24, 2019.
Disclaimer: We request all readers, electronic media and others follow our citation guidelines when re-posting articles from farmdoc daily. Guidelines are available here. The farmdoc daily website falls under University of Illinois copyright and intellectual property rights. For a detailed statement, please see the University of Illinois Copyright Information and Policies here.


