


The Financial Efficiency of Illinois Grain Farms: Operating Expense Ratio by Region
In assessing a farm’s financial performance, the operating expense ratio is helpful in evaluating financial efficiency by measuring the share of gross farm revenues used to cover a farm’s day-to-day operating costs. This ratio is calculated by dividing total operating expenses (excluding interest and depreciation) by gross farm returns. According to the Farm Financial Scorecard developed by the Center for Farm Financial Management, a farm with an operating expense ratio greater than 80% is considered vulnerable, a ratio between 60% and 80% is cautionary, and a ratio less than 60% is strong.[1] A lower ratio reflects greater financial efficiency, indicating that a larger share of the farm’s income is available for other uses after covering its operating expenditures. Monitoring this ratio allows farm operators to understand how effectively they are managing their core operating costs relative to their income.
In our previous article (see farmdoc daily, April 9, 2025), we found that the median operating expense ratio for Illinois grain farms has fluctuated over the past two decades, generally falling between the strong (<60%) and cautionary (60-80%) ranges. Despite improvements in financial efficiency in recent years, the operating expense ratio has been on the rise again. In 2023, a sharp decline in gross farm returns, combined with a rise in operating expenses, led to a substantial increase in the ratio, reaching a vulnerable (>80%) level. In this article, we examine trends in the operating expense ratio across the three regions of Illinois: (1) northern Illinois, (2) central Illinois, and (3) southern Illinois over the twenty-one-year period from 2003 to 2023 using data from Illinois Farm Business Farm Management (FBFM).
In both panels of the figure below, we use the color-coding system from the Farm Financial Scorecard to indicate the financial quality of the reported operating expense ratio. The region shaded in red indicates a vulnerable ratio, yellow represents a cautionary ratio, and green indicates a strong ratio. The top panel shows the median operating expense ratio across the three regions of Illinois. In the bottom panel of the figure, each year’s data is summarized using box-and-whisker plots, illustrating how spread out the operating expense ratios are across the three regions.[2] The components of the boxplot consist of (1) minimum (lowest value) or 0th percentile, (2) first quartile or 25th percentile, (3) median or 50th percentile, (4) third quartile or 75th percentile, and (5) maximum (highest value) or 100th percentile. The shaded box represents the middle 50% of values—half the data is within it—with its bottom edge marking the first quartile (25% of data falls below this point) and its top edge marking the third quartile (75% of data falls below this point). The thick line inside the box is the median (50th percentile), the exact middle value, where half the data is smaller, and half is larger. The lines (whiskers) extending from the box reach the minimum and maximum values of the data, showing the overall range of the operating expense ratio across grain farms, excluding extreme values.
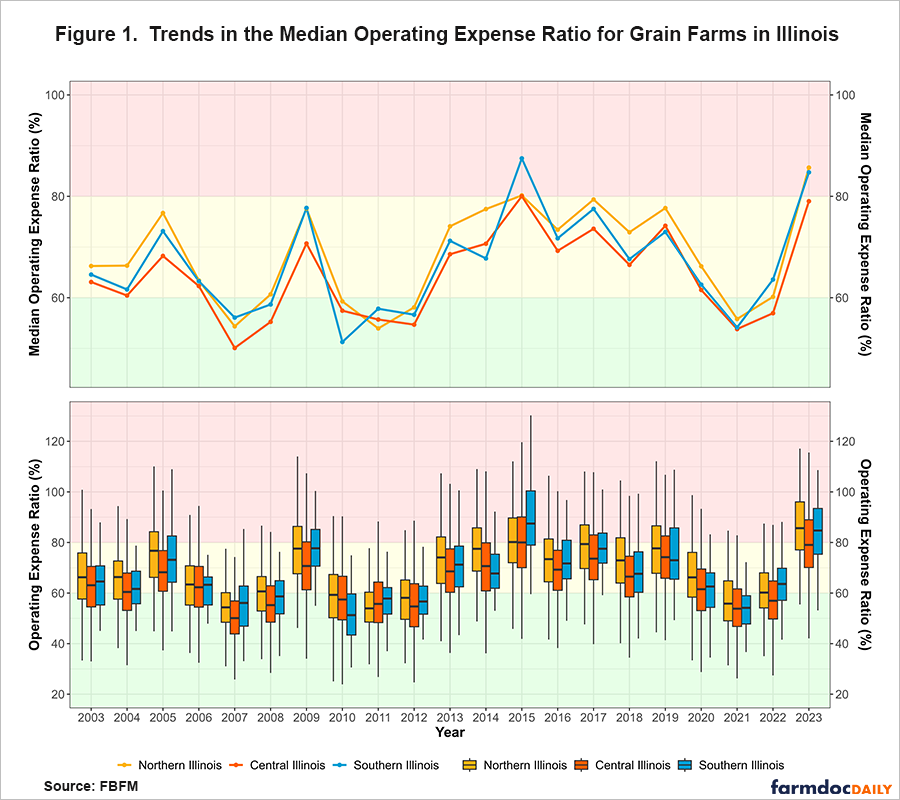
Over the last two decades, central Illinois grain farms have generally exhibited lower median operating expense ratios compared to farms in the northern or southern regions, with northern Illinois grain farms typically having the highest ratios. As shown in Figure 1 (top panel), the ratios have largely moved in tandem across all three regions. While specific instances saw the median ratio reach vulnerable (>80%) levels—in southern Illinois in 2015 and in both southern and northern Illinois in 2023—the overall median across the sample typically remained in the strong (<60%) or cautionary (60-80%) categories.
When considering the distributional differences within each region, Figure 1 (bottom panel) shows that in most years, the majority of grain farms seldom reached the vulnerable category. Recall that the shaded boxplots represent the middle 50% of values—half the reported operating expense ratios are within it—with their bottom edges marking the first quartile (25% of the data falls below this point) and the top edges marking the third quartile (75% of the data falls below this point). The lines (whiskers) extending from the top of the boxes represent the 25% of grain farms with the highest ratios. From 2021 onwards, we see how the operating expense ratio has trended higher across all three regions. Since then, the median operating expense has increased by 42.02% in northern Illinois, 30.18% in central Illinois, and 48.53% in southern Illinois. Over the same period, median gross farm returns declined by 2.41% in northern Illinois, 9.54% in central Illinois, and 27.08% in southern Illinois. As of 2023, the median operating expense ratio in northern Illinois stood at 85.67% (vulnerable), 79.03% (cautionary) in central Illinois, and 84.73% (vulnerable) in southern Illinois. A majority of grain farms in northern and southern Illinois reported ratios in the vulnerable range in 2023.
Conclusion
While the median operating expense ratio for Illinois grain farms typically remained within the strong (<60%) or cautionary (60-80%) ranges in most years, recent trends show a substantial decline in financial efficiency across all regions. Driven by recent declines in gross farm returns and sustained increases in operating expenses since 2021, the median ratio reached vulnerable levels (>80%) in northern and southern Illinois and approached that threshold in central Illinois in 2023. Given the uncertainty surrounding current trade disputes and imposed trade restrictions, along with the potential implications this situation represents for producers, our analysis demonstrates that financial efficiency should always be measured and monitored, as operating expenses and gross farm returns can vary significantly from year to year.
Acknowledgment
The authors would like to acknowledge that data used in this study comes from the Illinois Farm Business Farm Management (FBFM) Association. Without Illinois FBFM, information as comprehensive and accurate as this would not be available for educational purposes. FBFM, which consists of 5,000+ farmers and 70 professional field staff, is a not-for-profit organization available to all farm operators in Illinois. FBFM field staff provide on-farm counsel along with recordkeeping, farm financial management, business entity planning and income tax management. For more information, please contact our office located on the campus of the University of Illinois in the Department of Agricultural and Consumer Economics at 217-333-8346 or visit the FBFM website at www.fbfm.org.
Notes
[1] The Farm Financial Scorecard adheres to the guidelines set by the Farm Financial Standards Council
[2] Outliers (extreme values) of the operating expense ratio are not presented in our figure.
References
Mashange, G. and B. Zwilling. "The Financial Efficiency of Illinois Grain Farms: Operating Expense Ratio." farmdoc daily (15):66, Department of Agricultural and Consumer Economics, University of Illinois at Urbana-Champaign, April 9, 2025.
Disclaimer: We request all readers, electronic media and others follow our citation guidelines when re-posting articles from farmdoc daily. Guidelines are available here. The farmdoc daily website falls under University of Illinois copyright and intellectual property rights. For a detailed statement, please see the University of Illinois Copyright Information and Policies here.