


Nonemployer Businesses and the Geography of Self-Employment
Entrepreneurship can drive regional economic prosperity. The widespread increase in business applications demonstrates that since the pandemic there has been growing entrepreneurial energy across the nation (White, 2024). Business application data offers a timely glimpse into this interest, but many applications never materialize into actual businesses. Moreover, these figures reveal little about the nature of these ventures or their impact on local economies. The U.S. Census Bureau’s Nonemployer Statistics tracks businesses with no paid employees that are subject to federal income tax, and as a result helps fill this information gap.[1]
Nonemployer businesses represent most U.S. business establishments. Most are run by self-employed individuals operating unincorporated businesses, such as sole proprietorships. Often, these ventures provide a source of supplemental income rather than a primary income. The rise of online platforms—ranging from home-based retail to transportation services like Uber and Lyft, and short-term rentals like Airbnb and Vrbo—has made it easier for individuals to act on entrepreneurial impulses. As a result, the number of nonemployer businesses grew by 72% between 2000 and 2021, with women and people of color increasingly driving this growth (Conroy, Landini, and McDermott, 2025).
This article highlights key trends among nonemployer businesses using the most recent (2023) data released by the U.S. Census Bureau in May 2025. It begins by examining the geographic distribution of nonemployer businesses across the country, then explores how these patterns vary by county type. Finally, it identifies the most common sectors (based on 2-digit NAICS codes) for nonemployers and shows how these trends differ between metro and nonmetro areas.
Nonemployers Are Unevenly Distributed Throughout the Country
While the nation’s largest population centers have the greatest total number of nonemployer businesses, Figure 1 adjusts for population size by showing the number of nonemployers per 1,000 residents.[2] In 2023, the United States averaged 90.3 nonemployer businesses per 1,000 residents, though this figure varied widely across states. Leading the nation were several southern states like Florida (136.1) and Georgia (105.2), northeastern states such as New York (100.6) and Vermont (100.2), and mountain states including Colorado (103.0) and Wyoming (112.4). By contrast, the states with the lowest rates included Washington (69.5), Wisconsin (67.0), New Mexico (66.0), and West Virginia (53.5).
Despite state-level variation, metropolitan areas drove much nonemployer business activity. Among large metro areas (populations over 1 million), high concentrations were found in major cities like New York and Los Angeles, as well as rapidly growing Sunbelt metros such as Miami, Orlando, Atlanta, and Nashville. Medium-sized metros (250,000 to 1 million residents) with high rates of nonemployer activity included several Florida metros (e.g., Naples, Cape Coral, Port St. Lucie), the Texas border region (e.g., Laredo, McAllen), and cities like Boulder, CO and Bridgeport, CT. Smaller metros (less than 250,000) with the highest relative number of nonemployer businesses were often located in recreational or lifestyle destinations, including Bozeman, MT, Barnstable Town, MA, Santa Fe, NM, Kahului, HI, and Traverse City, MI.
The Scale of Nonemployer Businesses Varies by County Type
Entrepreneurial activity is generally higher in metropolitan areas than in nonmetropolitan regions, primarily due to greater market opportunities and population growth. Based on the USDA Economic Research Service’s County Economic Types, Figure 2 illustrates the varying scale of nonemployer businesses across these regions.[3] Recreation and retirement destinations, which are often places with natural amenities (e.g., coastlines, mountains, etc.), show higher than average levels of nonemployer businesses. Retirees and pre-retirees often bring valuable human, financial, and business capital and can play an important role in starting new ventures or investing in rural businesses (Deller, Kures, and Conroy, 2019).
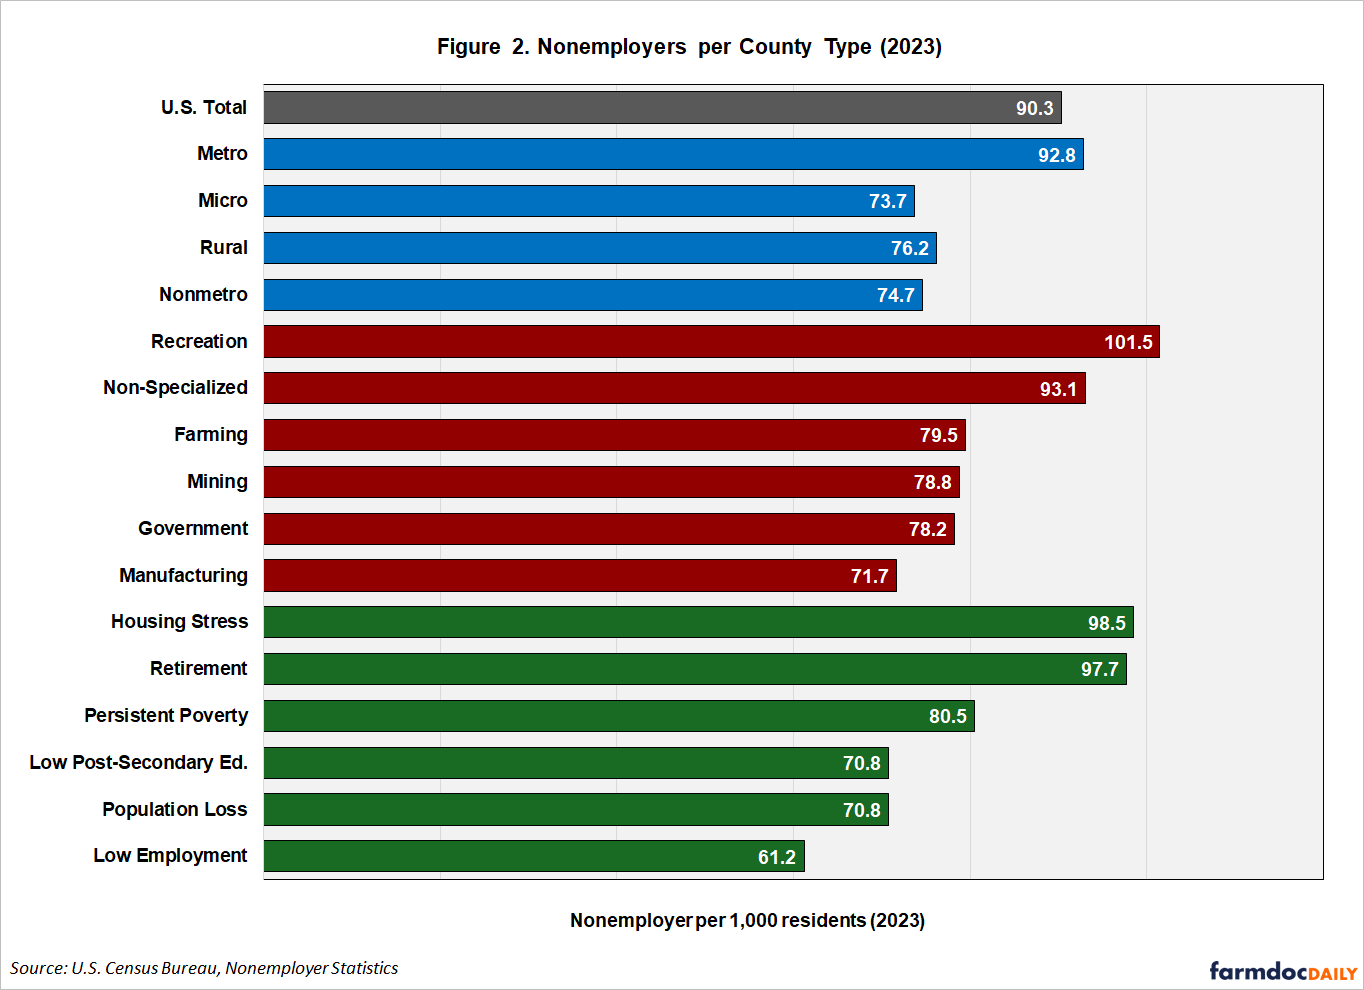
Other county types with above average levels of nonemployer businesses include nonspecialized counties. Nonspecialized counties are often suburban and exurban in nature, and many have experienced recent population growth. Housing-stressed counties—areas where residents are housing cost burdened or face substandard housing—are typically associated with relatively fast growth, and as a result also have relatively more nonemployer businesses. By contrast, relatively fewer nonemployer businesses are found in regions facing economic decline, such as those with population loss, low employment, and limited access to post-secondary education. Manufacturing-dependent areas also tend to exhibit lower levels of entrepreneurship. These regions often lack the market opportunities and human capital found in places with more dynamic entrepreneurial ecosystems.
Metro and Nonmetro Counties Offer Different Types of Self-Employment Opportunities
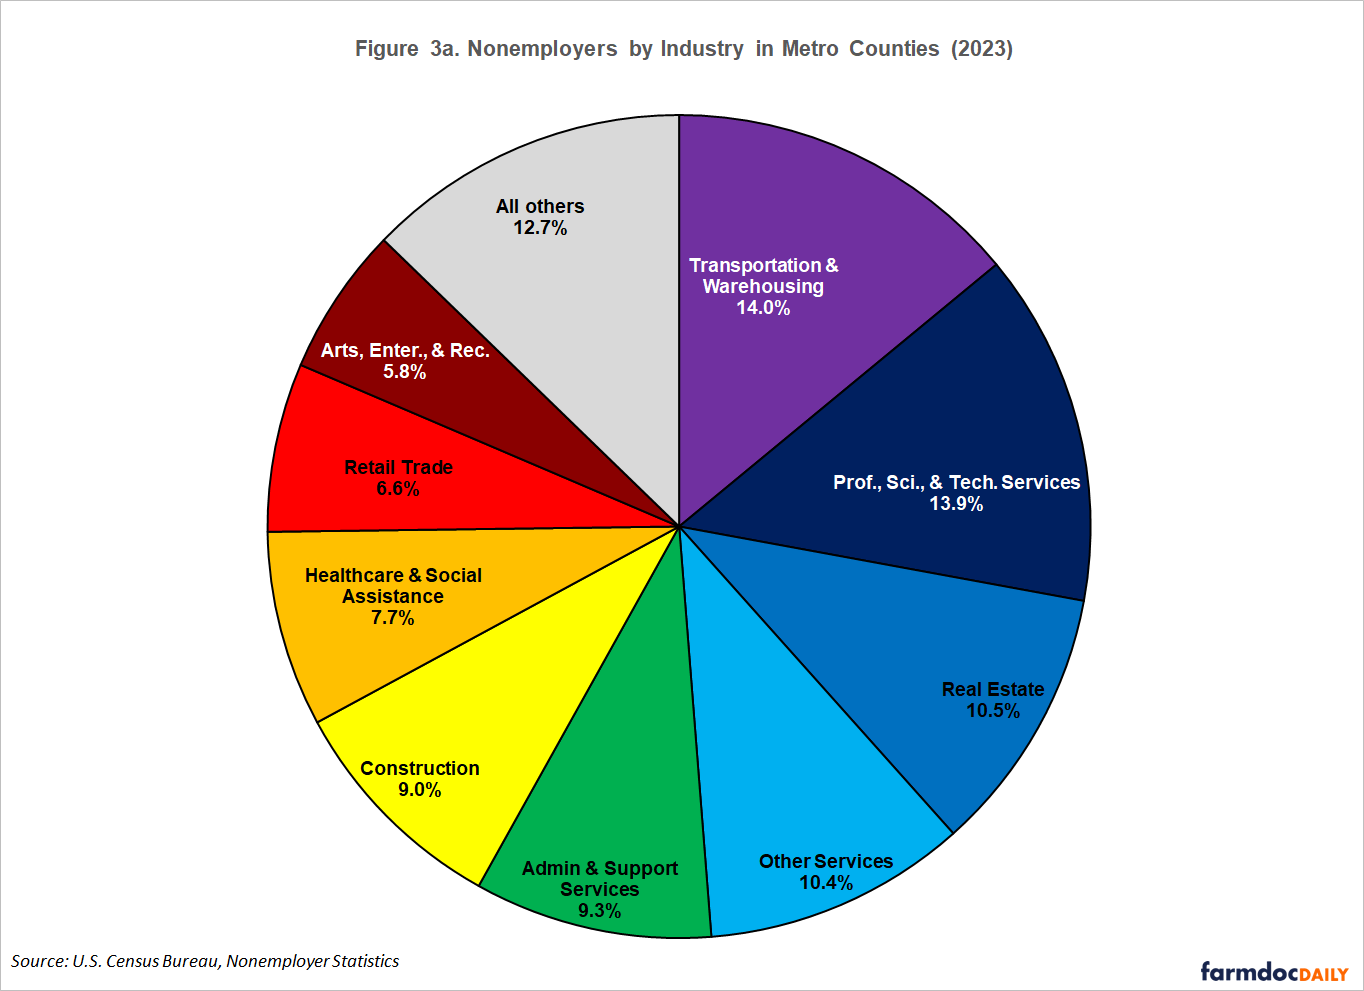
The scale and nature of entrepreneurial activity varies by county type. Figures 3a and 3b illustrate the distribution of nonemployer businesses by sector in metro and nonmetro counties, respectively.[4] In metro areas, higher population densities and concentration of economic activity create more market opportunities for nonemployer ventures, particularly in sectors like transportation (e.g., Uber, Lyft) and professional, scientific, and technical services. The latter often includes consulting opportunities suited for educated and experienced professionals. This sector comprises a significant share of nonemployer businesses not only in major urban centers (e.g., New York, Washington, D.C., Boston, San Francisco), but also in smaller cities with prominent universities (e.g., Ithaca, NY; Chapel Hill, NC; Corvallis, OR). Real estate activities (e.g., Airbnb, Vrbo) account for just over 10% of nonemployer businesses in metro counties, with the highest concentrations typically found in places with natural amenities, such as coastal regions in southwest Florida or ski resorts in Colorado.
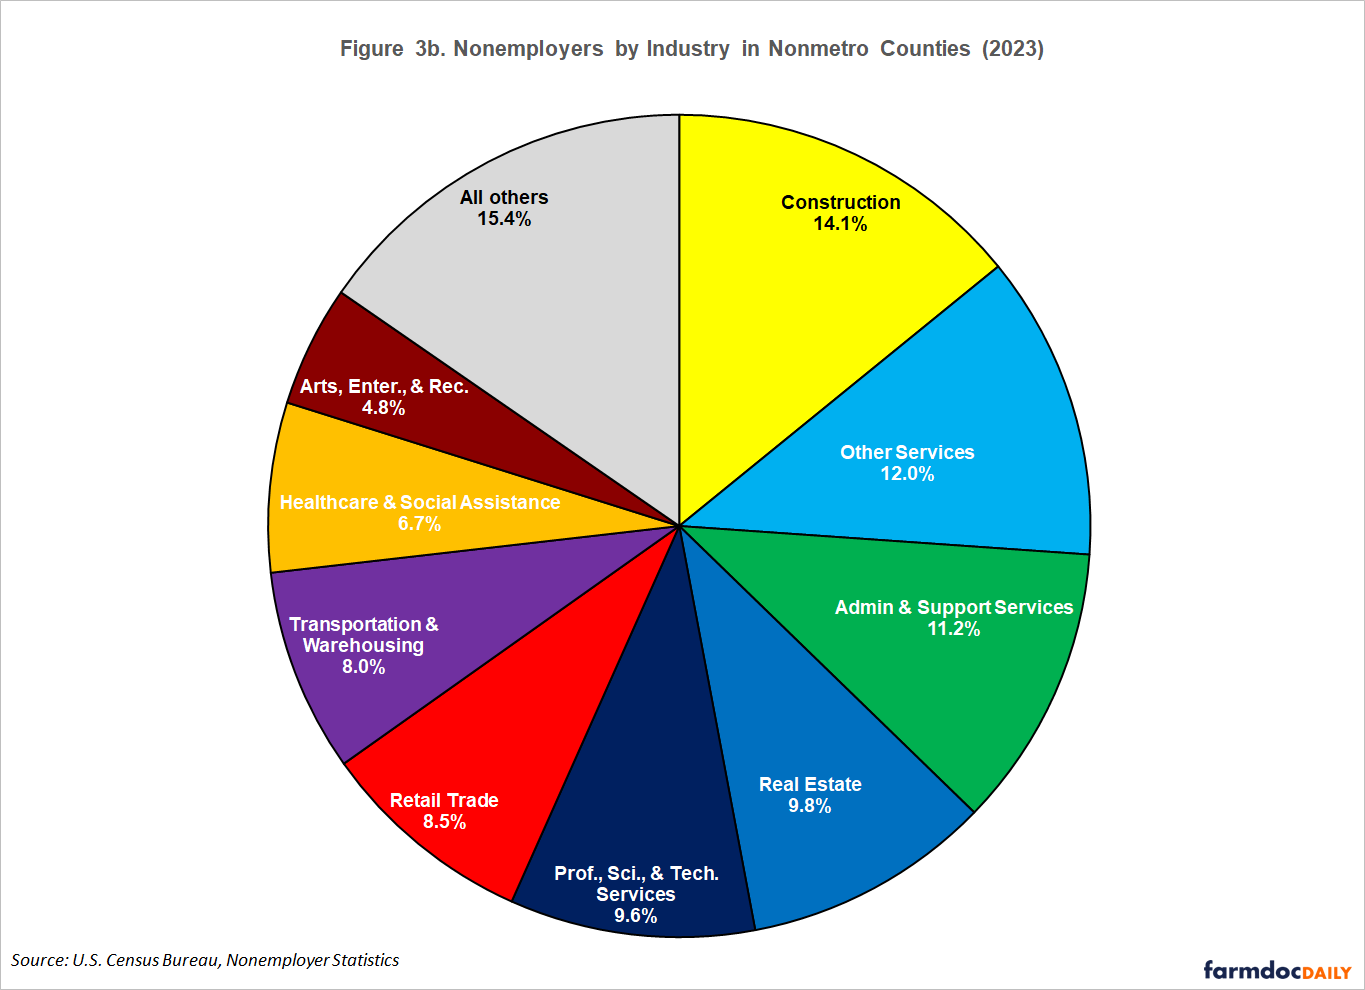
Nonmetro counties exhibit a different mix of nonemployer business activities. In nonmetro counties, construction accounts for approximately one in every seven nonemployer businesses. These ventures often involve trades-related work such as plumbing, electrical work, drywall installation, flooring, and painting—services that are essential to home building and maintenance. The “Other Services” category primarily includes personal care (e.g., hair, nail, and skincare services) and pet care, and represents another 12% of nonemployer businesses in nonmetro counties. These types of businesses are especially prevalent in regions such as the Southern Black Belt, the Mississippi Delta, and Central Appalachia. Additionally, landscaping and cleaning services—key elements of the administrative and support services sector—are another common source of nonemployer activity in nonmetro areas.
In some regions, nonemployer businesses reflect distinctive local economic opportunities. For example, areas with vibrant arts communities—such as Manhattan, Santa Fe and Taos, and Nashville—have a high concentration of nonemployer businesses in the arts, entertainment, and recreation sector. In Davidson County (Nashville, TN), for example, this sector accounts for 16% of all nonemployer establishments. Similarly, mining is a notable source of nonemployer activity in parts of West Virginia, Texas, and Kansas. In Alaska, natural resource-based sectors create opportunities for self-employment, with fishing, forestry, and hunting among the leading industries for nonemployer businesses.
Key Takeaways
Nonemployer businesses serve as an important source of income for many individuals across the country and are essential components of vibrant local entrepreneurial ecosystems. The entrepreneurs behind these ventures come from diverse backgrounds. In urban areas, a wide range of market opportunities allows individuals to pursue these businesses as either a primary occupation or a supplemental income stream. In rural regions, nonemployer activity is especially prominent in areas with large retiree populations and natural amenities.
The post-pandemic rise in entrepreneurial activity presents new economic opportunities for communities of all sizes. However, the diversity in scale and nature of these ventures makes it clear that no single strategy can effectively support all entrepreneurs. Communities must tailor their entrepreneurial support efforts to meet the specific needs of local entrepreneurs, including considerations of format, language, and content. The U.S. Census Bureau’s nonemployer statistics offer valuable insights into these local dynamics and can help guide the development of more responsive and inclusive entrepreneurial support efforts.
Notes
[1] The U.S. Census Bureau defines nonemployers as a business with no paid employees, generates at least $1,000 in annual business receipts, and is subject to federal income tax. These data originate from business income tax records collected by the U.S. Internal Revenue Service. The U.S. Census Bureau annually publishes data that describes nonemployer businesses at the county level and a detailed NAICS level of industry. A related source—the NES-D data—provides detailed demographic information about nonemployer businesses. More information about the Nonemployer Statistics is available on the U.S. Census Bureau website.
[2] These data draw from the 2023 Nonemployer Statistics and the 2023 county population estimates available through the U.S. Census Bureau’s Vintage 2024 population estimates.
[3] USDA ERS’ 2025 County Typology Codes classify all U.S. counties into six mutually exclusive categories of economic dependence—farm dependent, government dependent (which often includes counties with large state universities), manufacturing dependent, mining dependent, recreation counties, and nonspecialized counties. Nonspecialized counties are often found in more urban metro areas. USDA also identifies counties with low rates of post-secondary education, relatively low rates of labor force participation, counties that lost population between 2000 and 2020, counties experiencing stress on their housing supply, retirement destinations, and counties experiencing persistent poverty. More information about the county typology codes can be found on the USDA Economic Research Service website: https://www.ers.usda.gov/data-products/county-typology-codes/
[4] These industry data are presented at the relatively broad 2-digit NAICS level. The Nonemployer Statistics provide these data by more detailed NAICS codes but nevertheless exclude several industries including: Crop Production (NAICS 111); Animal Production and Aquaculture (NAICS 112); Postal Service (NAICS 491); Funds, Trusts, and Other Financial Vehicles (NAICS 525); Management of Companies and Enterprises (NAICS 55); Private Households (NAICS 814); and Public Administration (NAICS 92).
References
Conroy T., Landini A., and McDermott M. 2025. “Nonemployer Businesses Are Increasing in Number in Rural America.” Choices 40 (2). Available Online at https://www.choicesmagazine.org/choices-magazine/submitted-articles/nonemployer-businesses-are-increasing-in-number-in-rural-america
Deller, S., M. Kures, and T. Conroy. 2019. “Rural Entrepreneurship and Migration.” Journal of Rural Studies 66:30–42. https://doi.org/10.1016/j.jrurstud.2019.01.026
White, M. "Post-Pandemic Entrepreneurial Growth." farmdoc daily (14):135, Department of Agricultural and Consumer Economics, University of Illinois at Urbana-Champaign, July 22, 2024.
Disclaimer: We request all readers, electronic media and others follow our citation guidelines when re-posting articles from farmdoc daily. Guidelines are available here. The farmdoc daily website falls under University of Illinois copyright and intellectual property rights. For a detailed statement, please see the University of Illinois Copyright Information and Policies here.