


Inflation and Food Price Update: May 2025
For a couple of years now, American households have navigated a challenging period of rising prices. While the recent Consumer Price Index (CPI) data for April indicates a welcome moderation in overall inflation—cooling to its slowest annual rate since early 2021—many families continue to feel the pinch, especially at the grocery store and when dining out. In this article, we will discuss how the initial shock of the COVID-19 pandemic, and more recently, bird flu outbreaks have driven food prices. In some of our figures below, the shaded region representing the COVID-19 period is based on the World Health Organization’s official announcements, which declared it a global pandemic on March 11, 2020 (see WHO Statement, March 11, 2020), and marked its end on May 5, 2023 (see WHO Statement, May 5, 2023). The second shaded region represents the ongoing period of bird flu outbreaks across the country, which started in January 2022 when the USDA’s Animal and Plant Health Inspection Service (APHIS) confirmed the first case (see USDA APHIS).
In April, consumer prices rose 0.2% from the previous month, slowing the annual inflation rate from 2.4% to 2.3%, according to data from the Labor Department’s Bureau of Labor Statistics (see Consumer Price Index Summary, BLS, May 13, 2025). This was a surprising announcement, as many of us were expecting the ongoing trade disputes and recently implement tariffs by the Trump Administration to impact prices last month. However, the immediate effect of these tariffs may have been blunted, as many businesses reportedly built up inventory before the tariffs were imposed (see Young, L., WSJ, March 24, 2025). More recently, ports around the country have reported lower cargo shipments from China (see Pound, J., CNBC, April 2029). Looking ahead, the temporary 90-day reprieve granted by President Trump, which reduced tariffs on certain Chinese goods from 145% to 30%, is expected by some to result in retailers frantically stockpiling inventory during this period (see Yurkevich, May 14, 2025). While April’s inflation figures are a positive, the inflationary effects of tariffs might be deferred and could become more apparent in subsequent months.
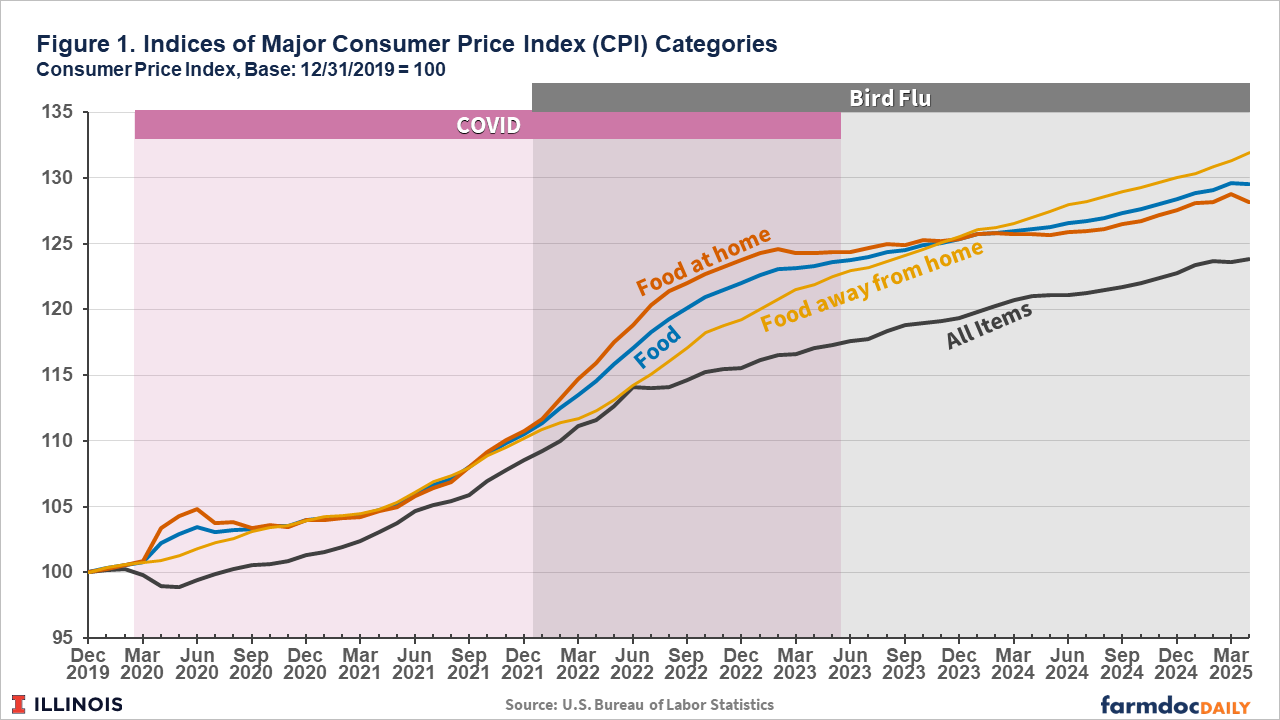
Although prices for all consumer goods and services have risen 23.9% since December 2019, as measured by the all-items CPI, prices for food have risen at a faster rate, as shown in Figure 1. Consumers often focus on level changes in prices, rather than rates of change like monthly measures of inflation. For example, since December 2019, food prices have risen 29.5%, leading to consumer frustration with prices and affordability (see farmdoc daily June 10, 2024, and September 16, 2024). In April, food prices decreased 0.1% from the previous month but are 2.7% higher than a year ago, on a seasonally adjusted basis. In August 2022, the rate of inflation for food reached 11.4%, the largest annual increase since May 1979.
The CPI for food is broken down into two subindices: Food Away from Home and Food at Home. The Food Away from Home Index tracks price changes for food purchased at restaurants, vending machines, and other food service establishments, whereas the Food at Home Index measures price changes for food bought at grocery stores and supermarkets. As Figure 1 shows, prices for food purchased away from home have outpaced that of food at home. Since December 2019, prices for food away from home have risen 31.9% compared to 28.2% for food at home. In April, prices for food away from home rose 0.4% from last month and are 3.9% higher than a year ago.
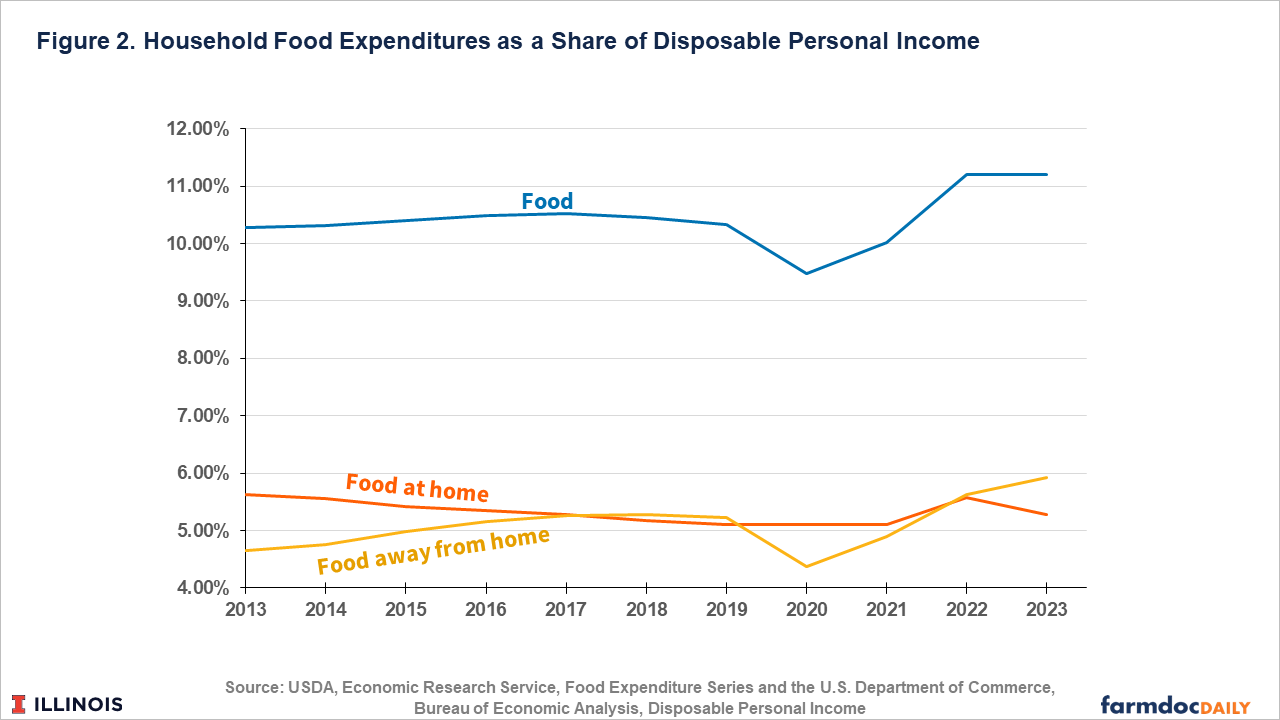
Consumers continue to express frustration with high food prices, in particular for food away from home (see farmdoc daily, March 7, 2024 and Redman, R., FBN, October 7, 2024). We have seen a shift in the spending patterns of U.S. consumers since the easing of COVID-19 related restrictions. As Figure 2 shows, the average share of disposable income spent on food away from home increased, surpassing the share spent on food at home. By 2023, the average share of food consumed away from home had risen to 5.93 percent, up from 5.63 percent the year prior, while the share spent on food at home fell to 5.28 percent from 5.58 percent. Overall, consumers are spending a larger share of their disposable income on food since the pandemic; the share has risen from 9.47 percent in 2020 to 11.21 percent in 2023.
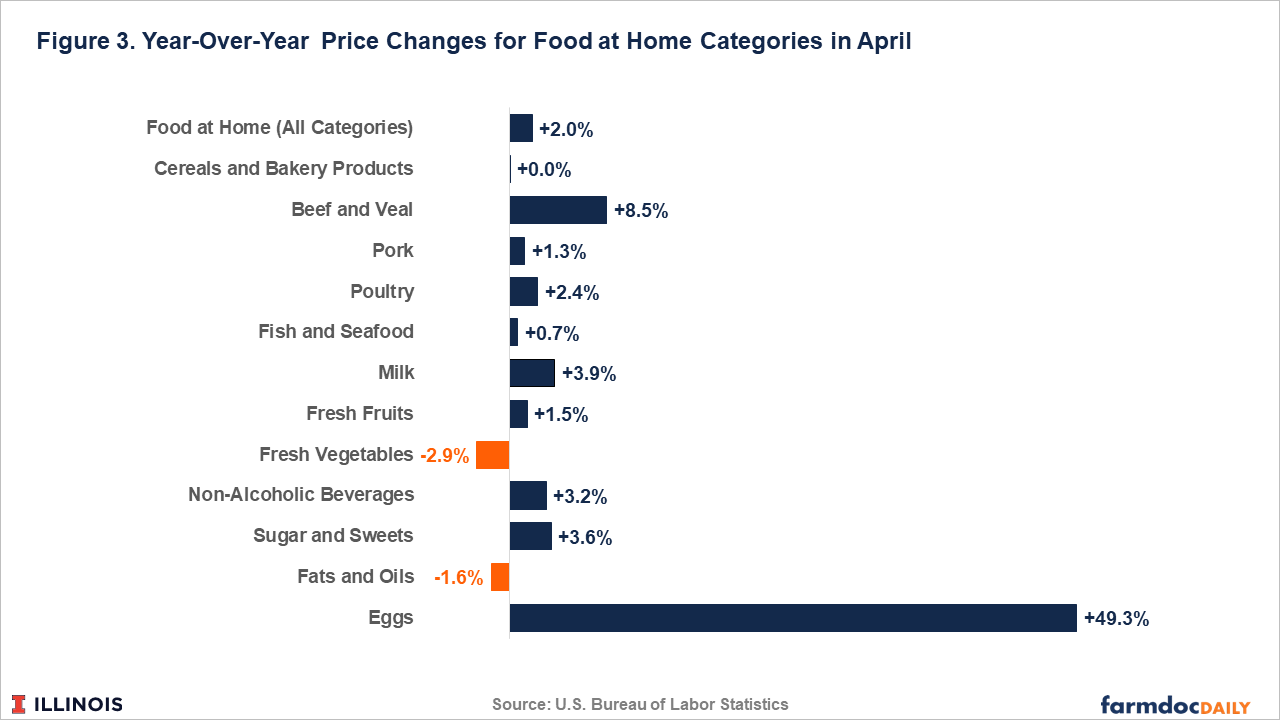
In April, prices for food consumed at home declined by 0.4% from the previous month—the largest monthly decline since September 2020. While the Food at Home Index is 2.0 percent higher on a year-over-year basis, this is a deceleration from the 2.4% rate recorded in March. Figure 3 details some of the components contributing to the annual increase in April. For meats, prices for beef and veal rose by 8.5 percent from a year ago while poultry and pork increased by 2.4% and 1.3%, respectively. Fish and seafood increased by 0.7%. Milk prices are 3.9% higher in April than they were 12 months ago, while fresh vegetables declined by 2.9%. The most anticipated category (at least in our view), eggs, are 49.3% higher than they were this time last year. However, on a month-over-month basis, egg prices fell by 12.7%. This was the sharpest monthly decline since March 1984.
Eggs prices in particular, have indeed been top of mind for consumers (see Durbin, D., AP News, May 13, 2025). But what is fueling this dramatic rise in egg prices? As of May 14, 2025, a total of 1,700 outbreaks of highly pathogenic avian influenza (HPAI), commonly known as bird flu, have been reported in the U.S. since January 2022—783 in commercial flocks and 917 in backyard flocks—according to data from APHIS (see APHIS Confirmations of HPAI and CDC HPAI Summary). These outbreaks have affected more than 169 million birds and contributed to a sharp rise in egg prices. In 2025 alone, approximately 31.3 million table egg layers have been lost to bird flu in the past four months (see Egg Markets Overview, May 9, 2025).[1] Compare these losses to all of 2024, where a total of 39.9 million were lost to a combination of bird flu and facility fires (see Egg Market’s Overview, January 3, 2025).
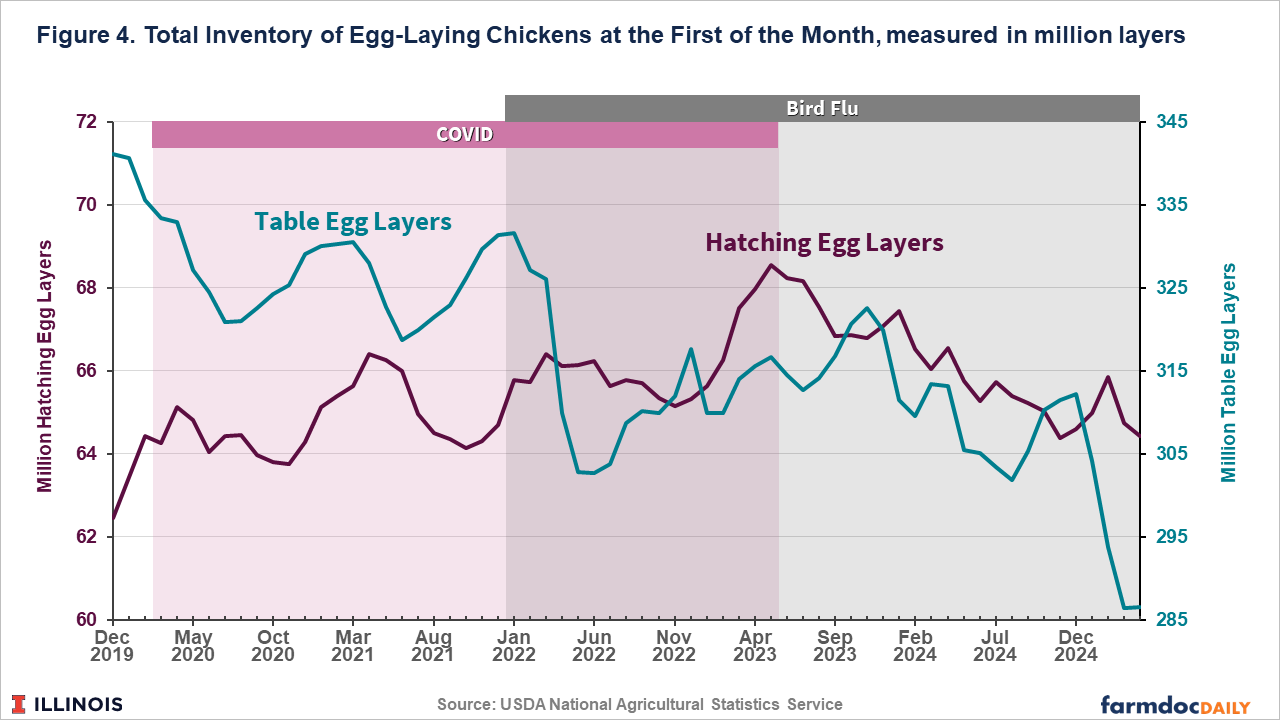
According to the USDA’s Chickens and Eggs report (see Chickens and Eggs, April 21, 2025), production fell to 8.63 billion eggs in March, a 7% decline compared to the same month last year, while the average number of egg-laying hens fell 8% year-over-year to 351 million. Figure 4 shows the total inventory of egg-laying chickens at the start of each month since December 2019 using data from the USDA’s National Agricultural Statistics Service. Between 2019 and 2021, the average monthly inventory was 330.4 million for table egg layers and 64.0 million for hatching egg layers. However, the monthly inventory levels for both types of layers have trended downward since the second half of 2023. As of April 1, there were 286.6 million table egg layers and 64.4 million hatching egg layers.
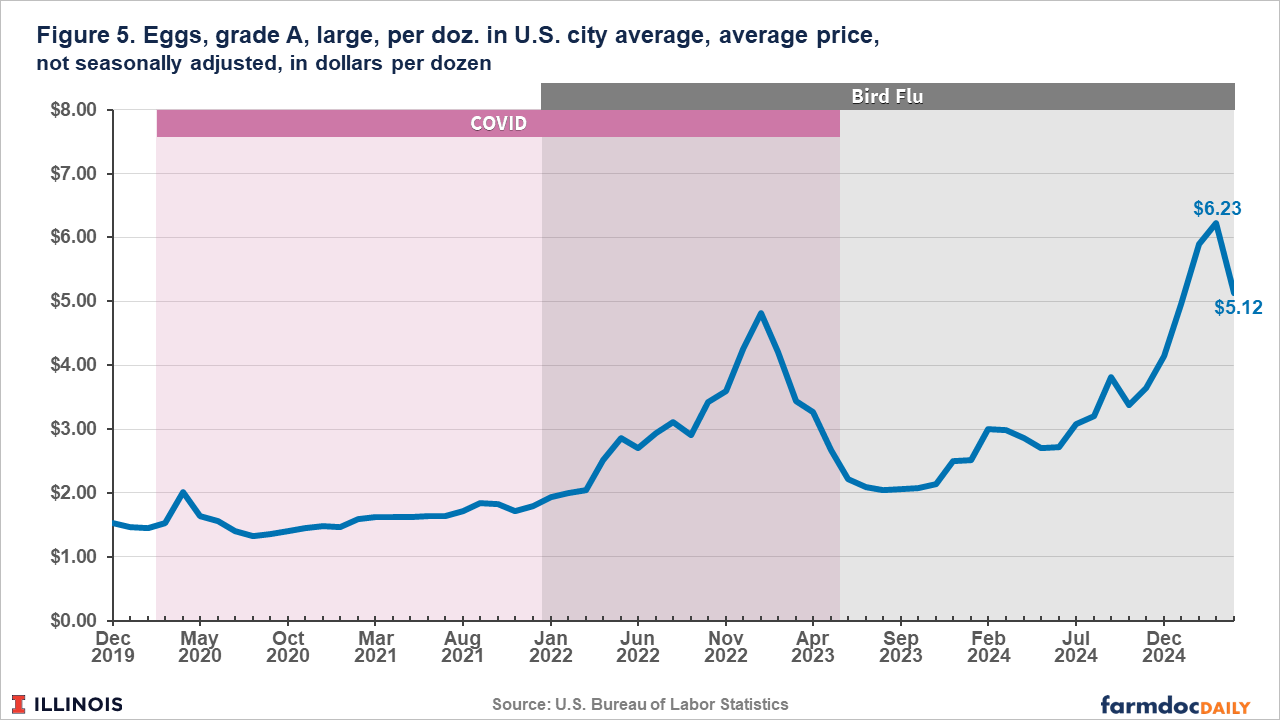
Despite the reduction in supply of table egg layers, egg prices eased in April. The average retail price for a dozen Grade A eggs fell to $5.12, down from $6.23 in March, according to data from the U.S. Bureau of Labor Statistics (as shown in Figure 5). This data illustrates the substantial upward trend in egg prices since the first HPAI case was reported. Average retail prices climbed from $1.93 in January 2022 to $4.83 by January of the following year—a 150% increase in 12 months. Although prices began to fall in the subsequent months, this trend reversed after August of 2023. Prices began rising again and peaked at $6.23 in March 2025. Over the entire bird flu period, from January 2022 to April 2025, the average retail price of a dozen Grade A large eggs has risen by 165.5%.
Conclusion
Rising food prices, and changes in consumer demand associated with the increases, have important implications for participants all along the food system. This month, the Labor Department’s Bureau of Labor Statistics report highlighted that overall inflation increased 0.2% in April from the previous month, slowing the annual inflation rate from 2.4% to 2.3%. Food price inflation, too, cooled. In April, food prices decreased 0.1% from the previous month but are 2.7% higher than a year ago, on a seasonally adjusted basis. Prices for food away from home rose 0.4% last month and prices for food at home declined by 0.4% from the previous month—the largest monthly decline since September 2020.
While rates of inflation have slowed, food prices are up 29.5% since December 2019, recent memory for the public, and consumers continue to be frustrated by prices and affordability (see farmdoc daily, September 16, 2024). Egg prices, up 49.3% from last year, driven primarily by supply constrictions from bird-flu, also continue to be a sticking point for consumers (see Durbin, D., AP News, May 13, 2025).
Note
[1] Table egg layers are hens that produce the eggs we find at grocery stores, whereas hatching egg layers produce eggs that become new chicken flocks.
References
Durbin, D. “US egg prices fall for the first time in months but remain near record highs.” Associated Press, May 13, 2025.
Ellison, B., M. Kalaitzandonakes and J. Coppess. "Consumers Continue to Struggle with Inflation and Food Affordability: Results From GFAPS." farmdoc daily (14):108, Department of Agricultural and Consumer Economics, University of Illinois at Urbana-Champaign, June 10, 2024.
Ellison, B., M. Kalaitzandonakes and J. Coppess. "Inflation is Cooling, but are Consumers Convinced? Results from GFAPS." farmdoc daily (14):167, Department of Agricultural and Consumer Economics, University of Illinois at Urbana-Champaign, September 16, 2024.
Kalaitzandonakes, M., J. Coppess and B. Ellison. "Sizing Up the Food System: US Consumers’ Perceptions of Food System Firm Sizes and Pricing." farmdoc daily (14):47, Department of Agricultural and Consumer Economics, University of Illinois at Urbana-Champaign, March 7, 2024.
Pound, J. “Port of Los Angeles says shipping volume will plummet 35% next week as China tariffs start to bite.” CNBC, April 29, 2025.
Redman, R. “Survey: Nearly 90% of consumers frustrated over grocery pricing.” Food Business News, October 7, 2024.
United States Department of Agriculture, National Agricultural Statistics Service, Agricultural Statistics Board. “Chickens and Eggs”. United States Department of Agriculture, National Agricultural Statistics Service, Agricultural Statistics Board, April 21, 2025.
United States Department of Agriculture, Agricultural Marketing Service. “Egg Markets Overview”. Agricultural Marketing Service, Livestock and Poultry Program, Livestock, Poultry, and Grain Market News Division, May 9, 2025.
United States Department of Agriculture, Agricultural Marketing Service. “Egg Markets Overview”. Agricultural Marketing Service, Livestock and Poultry Program, Livestock, Poultry, and Grain Market News Division, January 3, 2025.
World Health Organization. “WHO Director-General's opening remarks at the media briefing on COVID-19 - 11 March 2020.” World Health Organization, March 11, 2020.
World Health Organization. “Statement on the fifteenth meeting of the IHR (2005) Emergency Committee on the (COVID-19) pandemic.” World Health Organization, May 5, 2023.
Young, L. “Retailers bulk up inventories to blunt tariff impact.” The Wall Street Journal, March 24, 2025.
Yurkevich, V. “Tariffs devastated America’s ports. Soon, they could face a surge from stockpiling. CNN Business.” CNN Business, May 14, 2025.
Disclaimer: We request all readers, electronic media and others follow our citation guidelines when re-posting articles from farmdoc daily. Guidelines are available here. The farmdoc daily website falls under University of Illinois copyright and intellectual property rights. For a detailed statement, please see the University of Illinois Copyright Information and Policies here.