


The Lending Activity and Performance of the Farm Credit System and Community Banks Participating in Agricultural Lending
In today’s article, we compare the annual performance of community banks participating in agricultural lending with that of the Farm Credit System (FCS). Using data from the Federal Deposit Insurance Corporation (FDIC), we identify commercial banks that are classified as community banks with outstanding farm real estate or operating loans on their balance sheets. For the purpose of this analysis, we define agricultural community banks as those for which the combined total of farm real estate and operating loans represent at least 25% of their gross loans and leases, while those below this threshold are categorized as non-agricultural community banks. Data for the FCS is obtained from its annual reports, and we only present system-wide results.
The majority of commercial banks across the country, including those specializing in agricultural lending, are classified as community banks. According to the Federal Reserve, a community bank is defined as a banking organization with less than $10 billion in assets (see Community & Regional Financial Institutions). Community banks operate under a for-profit model and rely on relationship-based lending to serve the financial needs of individuals and businesses within their local communities. However, the business model of a community bank is different from that of the FCS. The FCS operates as a cooperative network made up of four system banks—CoBank, AgFirst, AgriBank, and the Farm Credit Bank of Texas—alongside 55 associations, as of December 31, 2024. The four banks jointly own the Federal Farm Credit Banks Funding Corporation, which is responsible for raising capital by issuing and marketing debt securities to support the system’s lending activities and operations. AgFirst, AgriBank, and the Farm Credit Bank of Texas are primarily owned by their affiliated associations, while those associations are owned by their borrowers. CoBank is owned by cooperatives, other eligible borrowers, and its affiliated associations.
Together, community banks—including other commercial banks not classified as community banks—and the FCS are the primary institutions engaged in agricultural lending. Collectively they hold the majority of outstanding agricultural loans. Figure 1 shows the total outstanding non-real estate farm (production and intermediate-term) loans held by the FCS, as well as by agricultural and non-agricultural community banks, while Figure 2 shows the outstanding balances of real estate farm loans. The FCS is the largest agricultural lender in the U.S., commanding a market share of 45.82% of all agricultural debt in 2023 compared to 34.93% for all commercial banks, according to data from the USDA’s Farm Income and Wealth Statistics. As of December 31, 2024, the FCS reported $81.21 billion in outstanding non-real estate farm loans and an even larger balance of $187.95 billion in real estate farm loans. In contrast, agricultural community banks held $36.34 billion in non-real estate farm loans and $46.52 billion in real estate farm loans, while non-agricultural community banks reported $18.06 billion in non-real estate farm loans and $40.01 billion in real estate farm loans.
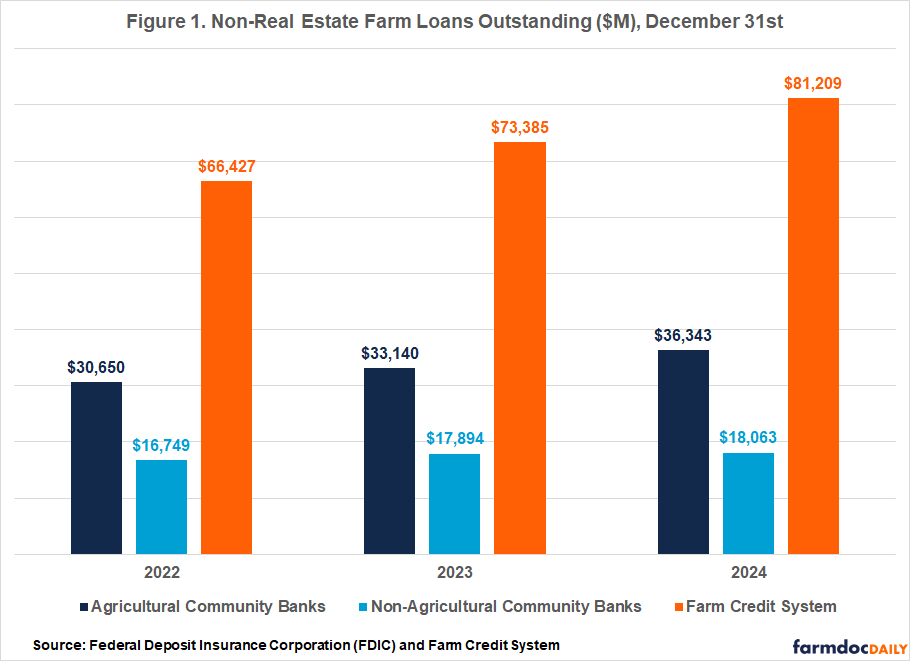
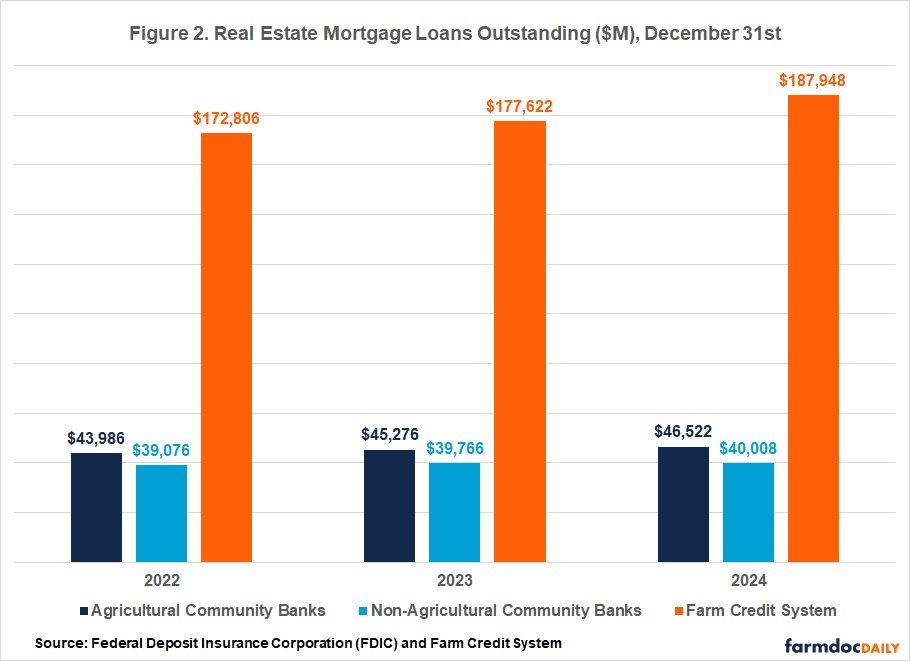
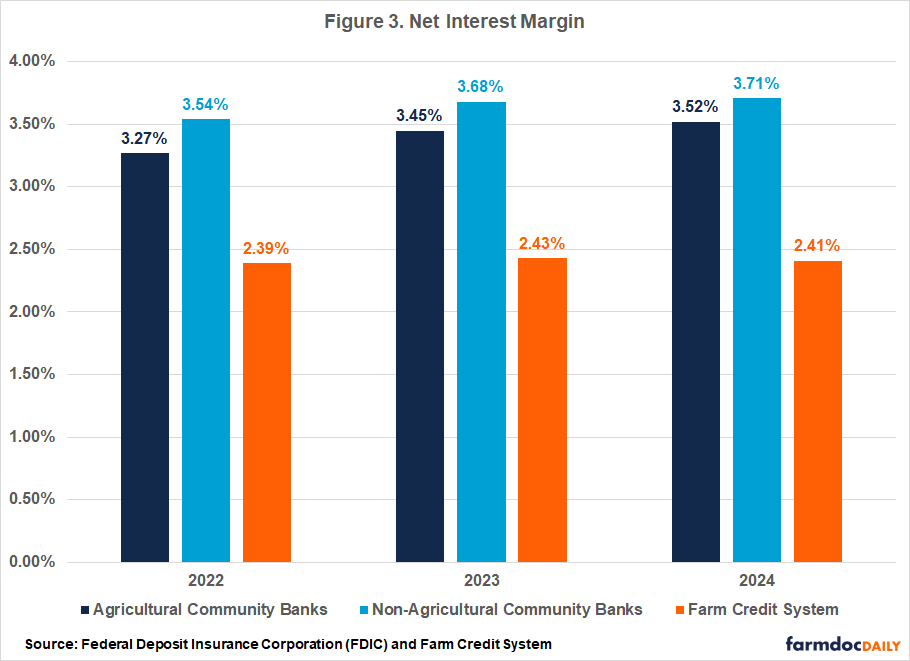
Figure 3 shows the Net Interest Margin (NIM) of the FCS, as well as the average NIM for agricultural and non-agricultural community banks. NIM measures a bank’s profitability and how well it manages the spread between what it earns on assets that generate income and what it pays to fund those assets. These earning assets include loans and other investments that earn interest or dividend income. For community banks, NIM is calculated as the difference between the total interest income and total interest expense (on deposits and other borrowed funds), as a percentage of average earning assets. Unlike community banks, FCS institutions do not accept deposits and instead rely primarily on funds raised by the Federal Farm Credit Banks Funding Corporation for its lending activities. Additionally, a portion of their earning assets are funded by non-interest-bearing sources (i.e., equity capital). Therefore, the calculation of NIM for the FCS includes the spread from both interest and non-interest-bearing sources. On average, agricultural and non-agricultural community banks reported higher NIMs than the FCS over the past three years. In 2024, the FCS reported a NIM of 2.41%, compared to an average of 3.52% for agricultural community banks and 3.71% for non-agricultural community banks. Lastly, the average NIM of community banks has increased over the years, while the NIM of the FCS fell slightly in 2024 compared to a year ago.
Conclusion
Both community banks and the Farm Credit System (FCS) play vital roles in financing U.S. agriculture, though they operate under different institutional models. The FCS is the largest agricultural lender, holding 45.82% of all agricultural debt in 2023, compared to 34.93% held by all commercial banks. As of year-end 2024, the FCS reported $81.21 billion in outstanding non-real estate farm loans and $187.95 billion in real estate farm loans. In contrast, agricultural community banks held $36.34 billion in non-real estate farm loans and $46.52 billion in real estate mortgages, while non-agricultural community banks held $18.06 billion and $40.01 billion in the same respective categories.
Disclaimer: We request all readers, electronic media and others follow our citation guidelines when re-posting articles from farmdoc daily. Guidelines are available here. The farmdoc daily website falls under University of Illinois copyright and intellectual property rights. For a detailed statement, please see the University of Illinois Copyright Information and Policies here.